How Will Visa Stock React To Its Upcoming Earnings?

Visa (NYSE:V) is set to report its Q4 FY’25 earnings (September fiscal year) around Tuesday, October 28, 2025. Revenues are expected to grow by about 10% year-over-year to $10.6 billion, per consensus estimates, while earnings are projected to come in at about $2.97 per share. Growth is expected to be driven by solid payment volumes, supported by resilient consumer spending across both discretionary and nondiscretionary categories. Cross-border payments, in particular, are likely to remain a key source of strength. Value-added services (VAS) are also likely to remain a significant driver of its growth trajectory. Over Q3 FY’25, VAS revenue grew by 26% year-over-year led by AI-driven fraud detection, real-time analytics, digital checkouts, and other payment security solutions.

Image by Miloslav Hamřík from Pixabay
There are two ways to do that: understand the historical odds and position yourself prior to the earnings release, or look at the correlation between immediate and medium-term returns post earnings and position yourself accordingly after the earnings are released. That said, if you seek upside with lower volatility than individual stocks, the Trefis High Quality portfolio presents an alternative – having outperformed the S&P 500 and generated returns exceeding 105% since its inception.
See earnings reaction history of all stocks
- Visa Stock Pullback: A Chance to Ride the Uptrend
- High Margins, 39% Discount: Buy Visa Stock Now
- Visa Stock Pays Out $127 Bil – Investors Take Note
- V Capital Return Hits $127 Bil in 10 Years
- V Has Returned $127 Bil To Shareholders In A Decade
- Better Bet Than Visa Stock: Pay Less To Get More From FOUR
Visa’s Historical Odds Of Positive Post-Earnings Return
Some observations on one-day (1D) post-earnings returns:
- There are 20 earnings data points recorded over the last five years, with 10 positive and 10 negative one-day (1D) returns observed. In summary, positive 1D returns were seen about 50% of the time.
- The percentage remains the same at 50% if we consider data for the last 3 years instead of 5.
- Median of the 10 positive returns = 2.6%, and median of the 10 negative returns = -1.3%
Additional data for observed 5-Day (5D) and 21-Day (21D) returns post earnings are summarized along with the statistics in the table below.
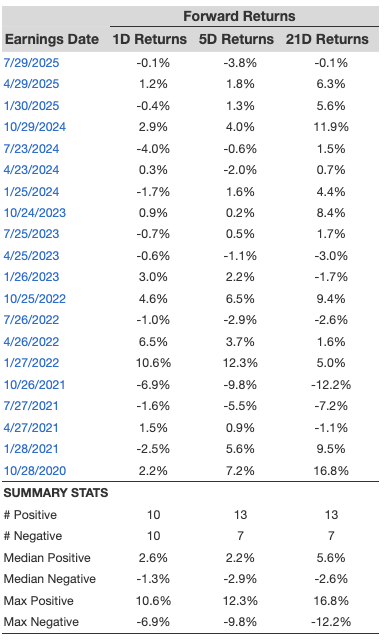
1D, 5D, and 21D Post Earnings Return
Correlation Between 1D, 5D, and 21D Historical Returns
A relatively less risky strategy (though not useful if the correlation is low) is to understand the correlation between short-term and medium-term returns post earnings, find a pair that has the highest correlation, and execute the appropriate trade. For example, if 1D and 5D show the highest correlation, a trader can position themselves “long” for the next 5 days if the 1D post-earnings return is positive. Here is some correlation data based on a 5-year and a 3-year (more recent) history. Note that the correlation 1D_5D refers to the correlation between 1D post-earnings returns and subsequent 5D returns.
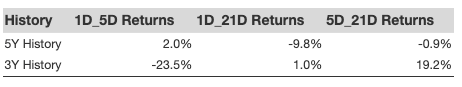
Correlation Between 1D, 5D and 21D Historical Returns
Learn more about Trefis RV strategy that has outperformed its all-cap stocks benchmark (combination of all 3, the S&P 500, S&P mid-cap, and Russell 2000), to produce strong returns for investors. Separately, if you want upside with a smoother ride than an individual stock like Visa, consider the High Quality portfolio, which has outperformed the S&P and clocked >105% returns since inception.