Tesla Vs. Biogen: Which Offers Better Risk/Reward?

Tesla (NASDAQ: TSLA) and Biogen (NASDAQ: BIIB) have similar market caps of roughly $40 billion and both companies have seen their stocks fall by roughly 25% this year. While Biogen stock has declined after it ended phase-3 trials of its Alzheimer’s drug Aducanumab in March, Tesla’s stock has been impacted by slower sales of its premium vehicles and issues with scaling up sales of the mass-market Model 3. However, stock price and corrections aside, the two companies could not be more different. Tesla has much higher revenues and has posted revenue growth of 65%+ each year over the last 3 years, compared to Biogen which has been growing at single digits. Biogen’s CEO recently said they need to be more like Tesla. In this analysis, we compare and contrast the key financials and valuation for the two companies and look at which company offers better risk and potential reward.
View our interactive dashboard analysis Tesla or Biogen, Which One Has Better Risk/Reward?
Tesla And Biogen Have Similar Market Caps
- How Will Tesla’s Earnings Trend After A Tough Q1 Delivery Report?
- With Deliveries Falling And Inventory Piling Up, What’s Next For Tesla Stock?
- Down Almost 20% This Year, Is Tesla Stock Good Value?
- Down 9% Year-To Date, Will A Q4 Earnings Beat Drive Tesla Stock Higher?
- With Delivery Growth Cooling, Is Tesla Stock Still A Buy At $250?
- Following A Lackluster Cybertruck Debut, Is Tesla Stock Overvalued At $240?
Tesla’s market cap stands at $40 billion, versus about $43 billion for Biogen.

Tesla’s Revenues Are Higher And Growing Much Faster Than Biogen’s
- Tesla posted revenues of $21.5 billion in 2018, versus $13 billion for Biogen. Tesla’s revenue growth rates over 2018 stood at over 80% compared to Biogen which saw growth of under 10%.
- See more on how Tesla valuation has been driven by record deliveries for Tesla Model S, X and Model 3 vehicles.
 Tesla’s Operating Losses Have Moderated, While Biogen Has Been Expanding Its Operating Profits
- Tesla’s operating losses have moderated to $0.4 billion in 2018, from over $1.6 billion in 2017.
- In comparison, Biogen is profitable, and its operating profits have been steadily trending higher, rising from about $4 billion in 2014 to $5.9 billion in 2018.

While Tesla’s Cash On Hand Is Higher, It Has A Higher Net Debt Position
- While Tesla’s cash position stands at about $5.4 billion, slightly ahead of Biogen with $4.3 billion, its net debt is higher, considering that its total debt stands at about $13 billion, compared to about $3 billion for Biogen.

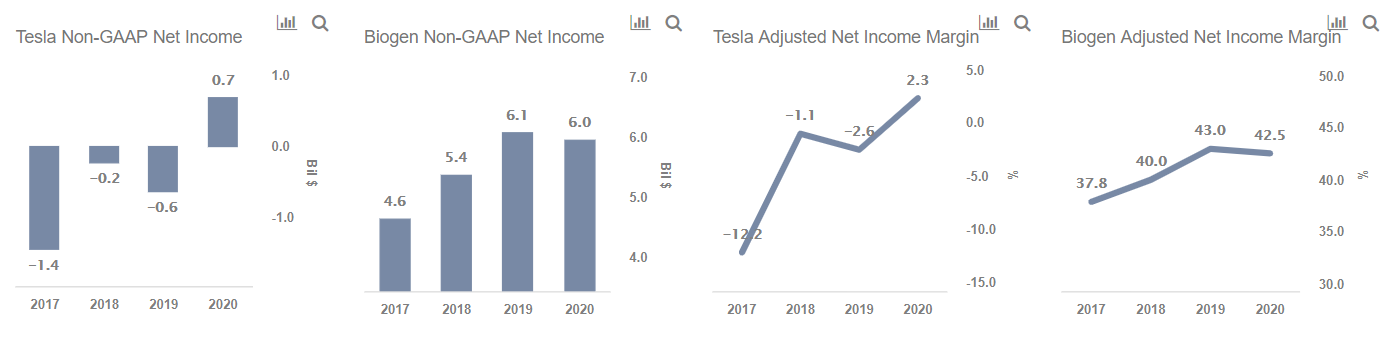
While Tesla’s Adjusted Net Profits Are Only Expected To Turn Positive In 2020, Biogen Is Consistently Profitable With Rising Margins
- Tesla is only expected to post an adjusted net profit around 2020, compared to Biogen which has been consistently profitable, with adjusted net margins of around 40%.
Tesla’s P/E Based On Exp. 2020 Results Is Significantly Higher Than Biogen’s
- Tesla’s P/E based on projected 2020 earnings stands at ~60x, versus 7x for Biogen, on account of higher long-term earnings growth projections for the company.

Tesla’s Price To Sales Multiple Is Lower Compared To Biogen’s
- Tesla’s P/S, based on projected 2020 revenues, stands at 1.3x versus 3x for Biogen. Biogen has a higher P/S since it is more efficient at converting revenues into cash flows (net margins stand at 40%+)

Conclusion
We believe that Tesla is a riskier stock, considering its high P/E, debt load, and the fact that it operates in a cyclical industry, which could make it more vulnerable if the economic cycle turns. Moreover, the company’s growth rates, which underpin its high P/E could come under threat given stagnating sales for its top-end Model S and X vehicles, with competition mounting from mainstream automakers for its entry-level Model 3. On the other hand, Biogen – with its significantly higher profits and lower debt – could be viewed as a safer bet, although it does face risks relating to its product pipeline, as demonstrated by the recent failure of its Alzheimer’s trials.
What’s behind Trefis? See How It’s Powering New Collaboration and What-Ifs
For CFOs and Finance Teams | Product, R&D, and Marketing Teams
Like our charts? Explore example interactive dashboards and create your own.