What Will Snap Look Like In 2023?

Snapchat’s parent company Snap (NYSE:SNAP) has seen its stock rise by 30% this year, with its market cap standing at roughly $32 billion. The stock now trades at over 15x projected 2020 revenues, despite the fact that the company is likely to post another loss this year. Does this make the stock expensive? Probably not, considering that revenues could grow by 2.5x by 2023, with Net Income turning positive and growing steadily, generating continued returns for shareholders. Here’s how this is possible.
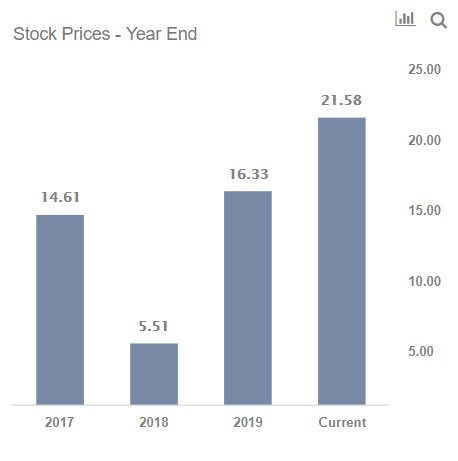
For more details on Snap’s historical performance, see our interactive dashboard what drove Snap stock up 50% Since The End Of 2017
Snap’s Revenues could grow by over 3x from estimated levels of a little over $2 billion in 2020 to close to $5 billion by 2025, representing a growth rate of roughly 31% per year (for context annual growth was about 60% between 2016 and 2019). There are multiple trends that support this continued growth. Firstly, Snap’s daily active user base has been expanding sharply, rising by about 17% y-o-y to 238 million during Q2 2020. Sure, part of this was due to Covid-19 and the related lockdowns, which forced people to stay home and socialize online, but Snap has actually seen growth in daily active users pick up over the last few quarters as well (it added a total of 52 million subscribers since Jan 2019). The growing user base, coupled with improving technology – such as Dynamic Ads which creates ads in real-time – could enable the company to boost ARPUs and overall revenues. Separately, the company is also gaining traction in the content space. The Discover section of its app, which offers curated content, reached an audience of over 100 million people on Snapchat this year. Ads on this platform could be valuable considering Snap’s young demographic which is quite difficult to reach with linear TV or commercial-supported streaming. [1]
- Up 6% In The Last Trading Session, Where Is Snap Stock Headed?
- Beating S&P500 By 62% Since The Start Of 2023, How Will Snap Stock Trend After Q4 Results?
- Up 91% YTD, What’s Next For Snap Stock?
- Is Snap Stock Attractive At The Current Levels?
- What To Expect From Snap Stock?
- Snap Stock Is Fairly Valued
While we expect Snap to post a loss this year, the company could turn around operations in 2021 as ad revenues pick up post the Coronavirus, and as the company’s past investments in R&D and product development start paying off. While Facebook posted margins of more than 25% in the last fiscal year (Net Income, or profits after all expenses and taxes, calculated as a percent of revenues), the company is a dominant force in the markets, and it is probably unreasonable to expect similar margins for Snap. However, it’s probably reasonable to assume that as Snap’s business gains scale, it can boost margins to about half the levels of Facebook in the next few years, so we estimate roughly 12.5% margins by 2023. Considering our revenue projections of roughly $5 billion and 12.5% margins, $625 million in Net Income is likely possible by 2023.
Now if Snap’s Revenues grow 2.5x, the P/S multiple will shrink to 0.4x its current level, assuming the stock price stays the same, correct? But that’s what Snap investors are betting will not happen! If Revenues expand 2.5x over the next few years, instead of the P/S shrinking from around 15x presently to about 6x, a scenario where the P/S metric falls more modestly, perhaps to about 10x looks more likely. For context, the broader Internet sector traded at a forward P/S multiple of about 7x, while Facebook trades at roughly 9x. One might assume that Snap will trade slightly ahead of these companies considering that it’s likely earlier in the growth cycle. [2] This would make growth in Snap’s stock price by about 60% a real possibility in the next three years, taking its market cap to over $50 billion. This would translate into a P/E multiple of about 80x based on our projected 2023 earnings for the company.
Want out-performance? Try guessing the % returns for our Pershing-inspired portfolio – based on billionaire Bill Ackman’s firm Pershing Square – vs. the S&P over the last 1 week, 1 month, 3 months, YTD or even 3 years. Our portfolio combines high growth, quality, and risk mitigation criteria in an interesting way.
See all Trefis Price Estimates and Download Trefis Data here
What’s behind Trefis? See How It’s Powering New Collaboration and What-Ifs For CFOs and Finance Teams | Product, R&D, and Marketing Teams
- Snap Q2 2020 Earnings Transcripts, Seeking Alpha, July 2020 [↩]
- Price To Sales Ratio by Sector, NYU Stern, January 2020 [↩]