What Will Shopify Look Like In 2025?

Shopify (NYSE: SHOP), a technology company that helps businesses get online by setting up e-commerce websites and handling related services, has seen its stock price rise by 2.5x this year, with its market cap standing at about $130 billion. The stock now trades at over 50x projected 2020 revenues and about 450x earnings. Does this make the stock expensive? Yes, the valuations look rich at the moment, but if the company executes well, we believe earnings could grow by over 7x by 2025, generating continued (although diminished) returns for shareholders. Here’s how this is possible.
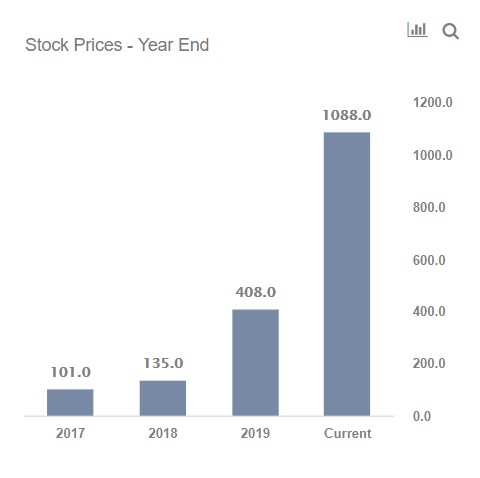
Did you know that Shopify Stock Grew 10x Since 2017? Here’s How.
Firstly, we believe that Shopify’s Revenues could grow by over 3.5x from estimated levels of $2.6 billion in 2020 to close to $9 billion by 2025, representing a growth rate of almost 29% per year (for context annual growth was about 60% over the last three years). There are multiple trends that support this. While the company’s core Software As A Service (SaaS) subscriptions have grown steadily (+30% in H1 2020), sales of merchant services such as payment processing, shipping, and financing have been growing much faster (almost 100%). The company is also moving into the fulfillment market, building out a distribution network in the U.S. to store and ship products from merchants to customers. Leveraging this, Shopify could position itself as a more merchant-friendly alternative to Amazon, which faces increasing antitrust scrutiny. Now the Covid-19 pandemic has also been a major tailwind for Shopify, as it has accelerated the shift of businesses online. For example, in Q2 2020, the number of shops on the Shopify platform grew 71% sequentially, while the gross merchandise value transacted on its platform was up 119% year over year. Considering these trends, we think that 3.5x growth in the top line over the next five years looks quite achievable as a base case.
- Rising 21% This Year, What Lies Ahead For Exxon Stock Following Q1 Earnings?
- Should You Pick General Electric Stock At $165?
- What’s Next For JetBlue Stock After A Sharp 19% Fall Post Q1 Results?
- Is Kimberly-Clark Stock Fairly Valued At $135 After A Solid Q1?
- How Will AMD’s AI Business Fare In Q1?
- Up 9% Year To Date, Will Chevron’s Gains Continue Following Q1 Results?
Combine revenue growth with the fact that Shopify’s margins (net income, or profits after all expenses and taxes, calculated as a percent of revenues) are projected to jump sharply from negative levels in 2019 to over 10% in 2020. We believe it’s possible that Shopify’s margins could expand further to close to 20% by 2025, driven by higher economies of scale and steadily higher margins for the fast-growing merchant solutions business. While Shopify doesn’t have any direct listed competitors, eBay posted average net margins of roughly 20% over the last 2 years. So is 7x growth in earnings possible in the next five years? Yes. Looks quite reasonable when you combine 3.5x revenue growth with the 2x growth that’s possible in Shopify’s margins.
Now if earnings grow 7x, the P/E multiple will shrink to 1/7th of its current level, assuming the stock price stays the same. But that’s exactly what Shopify investors are betting will not happen! If earnings expand 7x over the next few years, instead of the P/E shrinking from around 450x presently to about 65x, a scenario where the P/E metric falls more modestly, perhaps to about 110x looks more likely. For context, the broader online retail sector traded at a forward multiple of about 86x, while e-commerce bellwether Amazon trades at over 100x projected earnings. One might assume that Shopify will trade slightly ahead of these companies considering its asset-light model and the fact that it’s likely earlier in the growth cycle. [1] This would make growth in Shopify’s stock price by about 70% a real possibility in the coming years, taking its market cap to over $220 billion.
Want out-performance? Try guessing the % returns for our Pershing-inspired portfolio – based on billionaire Bill Ackman’s firm Pershing Square – vs. the S&P over the last 1 week, 1 month, 3 months, YTD or even 3 years. Our portfolio combines high growth, quality, and risk mitigation criteria in an interesting way.
See all Trefis Price Estimates and Download Trefis Data here
What’s behind Trefis? See How It’s Powering New Collaboration and What-Ifs For CFOs and Finance Teams | Product, R&D, and Marketing Teams
- PE Ratio by Sector, NYU Stern, January 2020 [↩]