Client Asset Growth Drove Schwab’s Impressive Monthly Metrics In August

Charles Schwab (NYSE:SCHW) saw a marked improvement across its key metrics in August. Interest earning assets, which generate over 49% of Schwab’s revenues, continued their robust growth (around 21% year over year). This surge has been at least partly driven by both the rate hikes over the past few months and the anticipation of further hikes in the year ahead. The Fed’s guidance on a possible hike in the near term is likely to further propel asset and revenue growth for this segment. 
We have a $57 price estimate for Schwab’s stock, which is higher than the current market price. Our interactive dashboard shows historical trends highlighting Schwab’s strong growth in key metrics; you can modify our forecasts for the asset base, yield on assets and other key metrics to assess their impact on the company’s total revenues


There has been increased demand among customers for expert asset management advice, and Schwab’s continued efforts are providing actionable insights and capitalizing on the company’s digital advisory strength. This has propelled growth in assets under management. The company’s focus on innovation in customer-centric financial products and personal guidance to customers is likely to increase revenues from the segment.
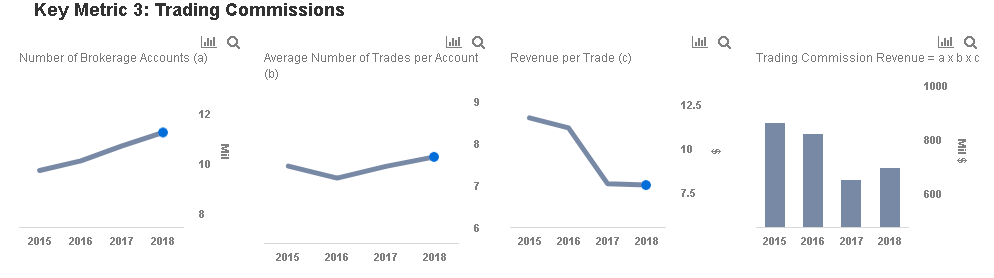
Meanwhile, trading revenues have been under pressure as brokerages have been forced to slash commissions in response to heightened competition from zero- and low-fee brokerages such as Robinhood. However, this revenue pressure should be largely offset by growth in trading volumes.
What’s behind Trefis? See How It’s Powering New Collaboration and What-Ifs
For CFOs and Finance Teams | Product, R&D, and Marketing Teams
Like our charts? Explore example interactive dashboards and create your own