Is Rio Tinto Set To Increase Its Global Iron Ore Market Share As Vale Falters?

Rio Tinto (NYSE: RIO), one of the largest iron ore miners in the world, has seen its iron ore segment grow continuously over the recent years. Growth of RIO’s iron ore division is crucial for the company as it contributes over 45% of Rio Tinto’s revenues. In this analysis, Trefis compares and contrasts RIO’s iron ore division’s growth and performance vis-à-vis its primary competitors and provides an outlook of the future course of business, amidst supply constraints and higher global prices.
You can view the Trefis interactive dashboard – How Does Rio Tinto’s Iron Ore Business Compare With Its Peers? – and make changes to our assumptions to arrive at your own forecast for RIO’s shipments, revenue, and market share. In addition, here is more Materials data.
A Look At Historical Revenue and Shipment Trends
- RIO has added over $4.5 billion in revenue from its iron ore business, over the last 3 years, with segment revenue increasing at a CAGR of 9.8%, from $14 billion in 2015 to $18.5 billion in 2018.
- In contrast, Vale and CLF have been able to add $11 billion and $0.8 billion, respectively, to their iron ore business during the same time.
- Though CLF has grown at over 20% in the last two years, its size is almost one-tenth that of RIO’s iron ore division.
- Among the major iron ore players, RIO has seen some fluctuation in its iron ore shipments in the recent years (due to operational disruptions), with volume rising in the last two years.
- However, total shipments have only increased at a CAGR of 1.2%, from 270.9 million tons in 2015 to 280.8 million tons in 2018.
- In contrast, competitors such as Vale and CLF have successfully increased their shipments at a much higher rate during this period, due to higher grade output and better productivity.
- Is Rio Tinto Stock Attractive At $62
- Down 9% This Year, What’s Next For Rio Tinto Stock?
- After Tough 2022 Results, What’s Next For Rio Stock?
- Is Rio Tinto Stock Still Good Value Following The Recent Iron Ore Rally?
- With Iron Ore Prices Under Pressure, What’s Next For Rio Stock?
- With Iron Ore Prices Volatile, Is Rio Tinto Stock Worth A Look?
Historical Price Realization
- Rio’s price realization per ton of iron ore has improved from $51.50 in 2015 to $65.80 in 2018.
- However, it has been lower than Vale and CLF over the previous three years, mainly due to premium pricing that their output enjoys due to higher grades.
- Vale and CLF benefited immensely due to environmental curtailments in China (use of only iron ore with Fe content more than 62%), which took prices upward.
- However, with most of RIO’s output being below par (less than 62% Fe), its price realization has been lower.
Forecasting Production and Shipments
- RIO’s iron ore production has steadily increased over the recent years, driven by higher output at Pilbara, its primary iron ore source.
- Production (RIO’s share at Pilbara) has increased from 263 million tons in 2015 to 281.8 million tons in 2018.
- However, production is expected to decrease to 275 million tons in 2019, driven by significant disruptions caused by Tropical Cyclone Veronica, and a fire at Cape Lambert A port in Q1 2019.
- Lower production would likely lead to shipments dropping from 280.8 million tons in 2018 to 273 million tons in 2019, followed by an increase in 2020, as production increases.
- At the same time, Vale’s production for 2019 is expected to fall by close to 40 million tons, due to another major dam burst in Brazil in January 2019.
- In contrast, CLF is expected to see a steady rise in its production output.
Price Movement
- Iron ore prices recently reached a multi-year high, led by expectations of supply shortage following production cuts by Vale and rising demand from China, with the Chinese mills producing steel at an annualized rate of more than 1 billion tons.
- After rising to over $100, iron ore prices fell to $94 per ton on August 7, 2019, due to re-escalation of US-China trade tensions.
- This could lead to Rio’s iron ore business realizing prices close to $85 per ton in 2019, which is later expected to drop to $77 per ton in 2020.
Revenue Expectations
- Rio’s Iron ore revenue is expected to see a sharp increase from $18.5 billion in 2018 to $23.2 billion in 2019, led by significant rise in global prices due to supply constraints (as Vale has cut down on its production target for the year) and change in the environmental policy in China, partially offset by lower volume due to operational disruptions.
- Revenue could see a slight drop in 2020, as prices come down due to a pick up in supply.
- Despite lower shipments due to production cuts, Vale’s iron ore revenue is expected to increase, driven by a sharp rise in its price realization, due to much better grade quality.
- Higher shipments and a rise in prices is expected to lead to a modest rise in CLF’s iron ore revenue over the next two years.
- However, the expected increase in RIO’s iron ore revenues is likely to be much higher compared to VALE and CLF.
Can RIO Gain Market Share?
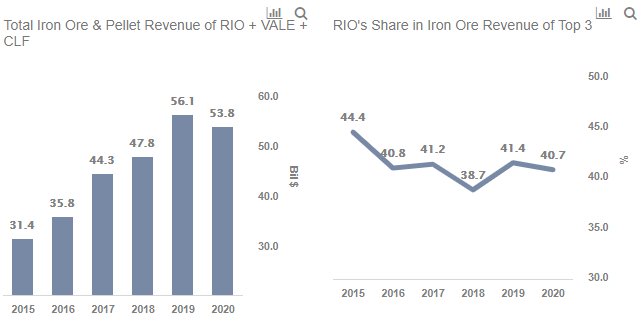
- RIO’s share in the total iron ore and pellet revenue of the three players – RIO, VALE, and CLF – has declined from 44.4% in 2015 to 38.7% in 2018, as Vale and CLF benefited much more from premium pricing for its output.
- However, with Vale reducing its production and, in turn, shipment guidance, this could be a golden opportunity for RIO to grab the market share that Vale would cede in 2019.
- In such a scenario, Rio’s market share in the iron ore segment could increase from 38.7% in 2018 to 41.4% in 2019.
- Despite a slight drop expected in 2020, RIO’s market share would still be above 40%.
Eating into Vale’s market share bodes well for Rio Tinto’s outlook as well as stock price movement. As per Rio Tinto Valuation done by Trefis, we have a price estimate of $62 per share for RIO’s stock.
What’s behind Trefis? See How It’s Powering New Collaboration and What-Ifs
For CFOs and Finance Teams| Product, R&D, and Marketing Teams
Like our charts? Explore example interactive dashboards and create your own.