How Have Roche’s Revenues And Profits Changed In Recent Years?

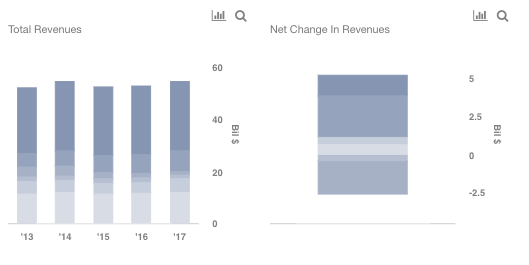
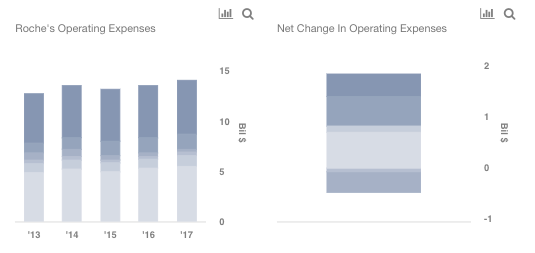
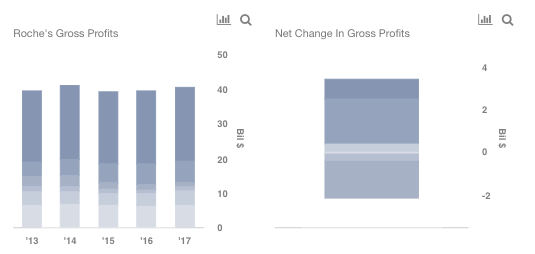
Roche’s (NASDAQ:RHHBY) revenues have increased by $2.6 billion (net) between 2013-2017. Most of this change was led by growth in its autoimmune and oncology drugs. Expenses also grew by $1.4 billion during the same period. In-vitro diagnostics accounted for most of this change in expenses. Looking at gross profit, autoimmune drugs accounted for most of the change during the same period.
Most of this growth in autoimmune drugs was led by Actemra, followed by Xolair, and MabThera. Both MabThera and Xolair face loss of exclusivity in the U.S. in 2018/2019 while Actemra has already lost its exclusivity. As such, these drugs will likely face biosimilar competition, and we expect the future sales to decline. However, in 2018, we estimate the segment sales to be more or less flat.
On the other hand, oncology drugs should continue to see growth, thanks to new drugs in Roche’s oncology portfolio, including, Tecentriq, Perjeta, and Alecensa, among others. We expect that these drugs will more than offset revenue losses from MabThera, Avastin, and Herceptin, which will mostly lose their exclusivity in the U.S. in 2018/2019. Note that these three are blockbuster drugs for Roche, accounting for roughly 35% of company-wide sales in 2017. Overall we expect the segment to grow 3.6% in 2018 led by its new drugs.
We have created an interactive dashboard on how Roche’s revenues, expenses, and profits have changed over the last five years, and our estimates for 2018. You can adjust the expected segment-wise revenue and margin forecast for 2018, and see its impact on the profitability, and earnings.
Change In Revenues By Division Between 2013 and 2017
Change In Operating Expenses By Division Between 2013 and 2017
Change In Gross Profits By Division Between 2013 and 2017
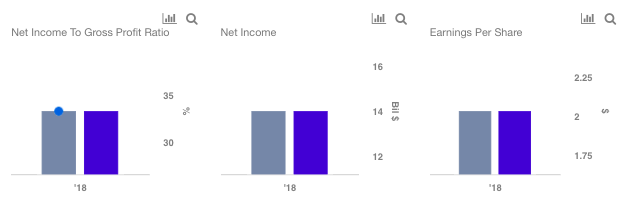
Trefis Estimates For 2018


2018 Gross Profit Calculation

Net Income And Earnings
Our price estimate of $36 for Roche implies a premium of around 20% to the market.
What’s behind Trefis? See How it’s Powering New Collaboration and What-Ifs
For CFOs and Finance Teams | Product, R&D, and Marketing Teams
Like our charts? Explore example interactive dashboards and create your own