Why Is Procter & Gamble’s Stock Not Taking As Bad A Hit As The S&P?

This week, the stock markets saw their biggest sell off since the 2008 crisis. There were two distinct trends driving the sell-off. Firstly, the increasing number of Coronavirus cases outside China is causing mounting concerns of a global economic slowdown. Secondly, crude oil prices plummeted by more than 20% after Saudi Arabia increased production.
Procter & Gamble (NYSE: PG) stock has fallen around 16% this week, and is down by a total of 18% since early February, considering the fact that consumer product sales are not expected to take a major hit, and sanitary and health care products could, in fact, see a surge in sales.
However, going by the trends seen during the 2008 economic slowdown, it’s likely that P&G stock could slide further, although at a rate slower than that of the S&P.
In our interactive dashboard analysis, 2007-08 vs. 2020 Crisis Comparison: How Did Procter & Gamble Stock Fare Compared with S&P 500?, we take a look at how the company’s stock reacted to the economic crisis of 2008 and compare its performance with the S&P 500.
P&G Stock vs. S&P 500 Over 2020 Coronavirus/Oil Price War Crisis
- Is Procter & Gamble Stock Appropriately Priced At $160?
- Should You Pick Procter & Gamble Stock At $155 After A Mixed Q2?
- Is Procter & Gamble Stock Fully Valued At $150?
- Will Procter & Gamble Stock Continue To Rise After 27% Gains In The Ongoing Inflation Shock?
- Should You Buy TMUS Over Procter & Gamble Stock For Better Returns?
- Should You Buy Colgate-Palmolive Stock At $80?
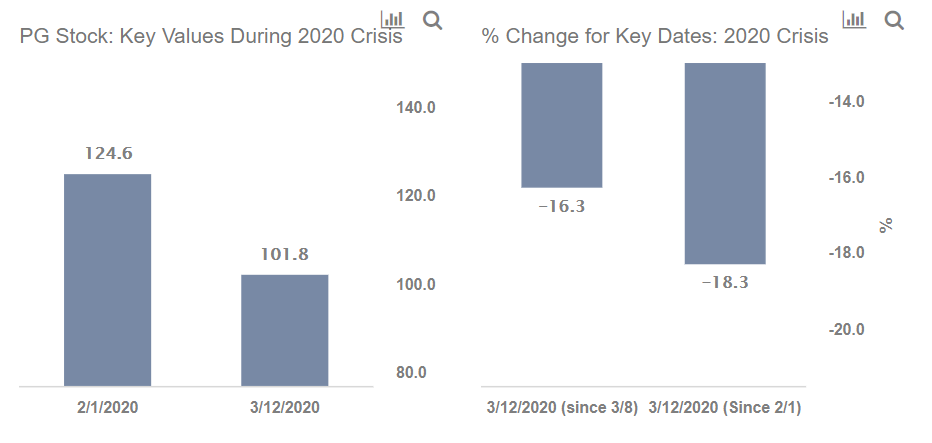
- P&G stock has declined by over 16% this week and the stock is down by about 18% since February 1, after the WHO declared a global health emergency.
- The S&P 500 has declined by 16.5% so far this week and has fallen by 25.4% since February 1, after the global health emergency was declared by the WHO.
To see how Colgate-Palmolive, a close competitor, performed over the same period, view our interactive dashboard: 2007-08 vs. 2020 Crisis Comparison: How Did Colgate Palmolive Stock Fare Compared with S&P 500?
P&G Stock vs S&P 500 Over 2007-08 Financial Crisis
- P&G stock declined from levels of around $49 in October 2007 (the pre-crisis peak) to levels of around $34 in March 2009 (as the markets bottomed out) and recovered to levels of about $44 in early 2010.
- Throughout the crisis, P&G stock declined by as much as 30% from its approximate pre-crisis peak. This marked a slower decline than the S&P which fell by as much as 51%.
- However, the stock also recovered relatively slowly, rising by 30% between March 2009 and January 2010. In comparison, the S&P rose by about 48% over the same period.
See all Trefis Price Estimates and Download Trefis Data here
What’s behind Trefis? See How It’s Powering New Collaboration and What-Ifs For CFOs and Finance Teams | Product, R&D, and Marketing Teams