Norfolk Southern’s Q1 Beat Led By Margin Expansion

Norfolk Southern (NYSE:NSC) reported its Q1 earnings yesterday, and they came in above our estimates, led by margin expansion. This note details the company’s Q1 performance, and Trefis’ forecasts for the full year 2019. You can view our interactive dashboard analysis ~ How Did Norfolk Southern Fare In Q1, And What Can We Expect From Full Year 2019? for more details on the key drivers of the company’s expected performance. In addition, you can see more of our data for Industrial companies here.
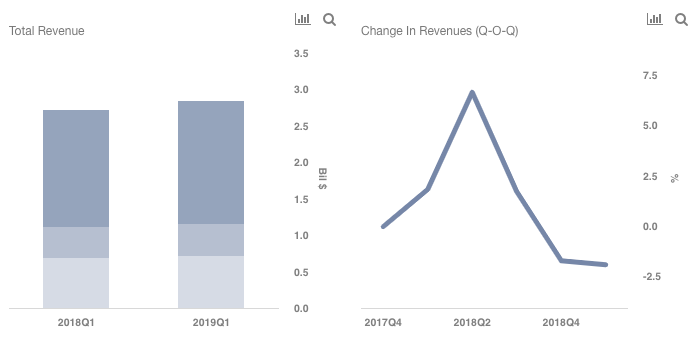
How have Norfolk Southern’s revenues changed over recent quarters, and what’s the forecast for full year 2019?
- Total Revenues for Norfolk Southern have largely trended higher over recent quarters.
- Revenues grew from $2.72 billion in Q1 2018 to $2.84 billion in Q1 2019.
- The growth can primarily be attributed to pricing gains.
- We estimate the revenues to be a little under $12 billion for the full year 2019; a figure 4% higher than 2018.
- What’s Next For Norfolk Southern Stock After A 21% Fall This Year?
- Which Is A Better Railroad Pick – Norfolk Southern Stock Or CSX?
- Will Norfolk Southern Stock Rebound To Its Pre-Inflation Shock Highs?
- Will Norfolk Southern Stock Trade Higher Post Q1?
- Why Did Norfolk Southern Stock Fall 30% Since 2021?
- Pick Either Norfolk Southern Stock Or This Travel Company: Both May Offer Similar Returns
What are Norfolk Southern’s key sources of revenues?
- Norfolk Southern generates its revenues primarily from various commodities freight, including merchandise, coal, and intermodal.
- Intermodal refers to the shipment of containers that can be moved from one form of transport to another, and it accounts for 25% of the company’s total revenues.
- Merchandise freight revenues are derived from the shipment of merchandise commodities, including agriculture, metals, paper, chemicals, and automotive related goods. This is the largest segment with close to 60% contribution to the company’s top line.
How did Merchandise freight fare in Q1 and how much can it grow in 2019?
- Norfolk Southern’s merchandise freight grew from $1.60 billion in Q1 2018 to $1.68 billion in Q1 2019.
- This can partly be attributed to higher pricing and fuel surcharge in the recent quarters.
- We forecast the revenues to grow in mid-single-digits for the full year 2019.
- This growth will likely be led by better pricing, and a slight uptick in volume for chemicals, metals, and forest products, as an expected growth in construction will likely bode well for the railroad shipments.
- Note that the U.S. construction sector is forecast to grow in mid-single-digits over the next three years.
How much can Intermodal segment revenues grow?
- Intermodal segment revenues have grown from $679 million in Q1 2018 to $719 million in Q1 2019.
- This can primarily be attributed to continued capacity constraints in the trucking industry, amid driver shortage after the full implementation of the ELD Mandate.
- This trend will likely continue in the near term.
- We forecast the segment revenues to grow in mid-single-digits to $3.13 billion for the full year.
What to expect from the Coal segment?
- Coal freight revenues remained flat (y-o-y) at around $435 million in Q1. The company saw a decline in volume, which was offset by better pricing and higher fuel surcharge revenue.
- The drop in coal shipments can be attributed to favorable natural gas prices. The benchmark Henry Hub natural gas price is currently trading under $3 levels, falling from the highs of $4.50 in late 2018.
- This will also impact the domestic coal consumption, which is estimated to be at a multi-year low of 603 million short tons (mst) in 2019.
What will be the impact of the above on Norfolk Southern’s EPS?
- Norfolk Southern’s Q1 earnings were $2.53 per share, as compared to our estimate of $2.20.
- This beat was led by better than expected margin expansion. The margin expansion will likely be visible for the full year.
- Net income margin of 23.8% in Q1 reflected a 350 bps improvement over Q1 2018.
- Operating ratio stood at 66% in Q1, reflecting 330 bps improvement over the prior year period. The company is focused on reducing its operating ratio by better managing costs and improving efficiency.
- As such, we expect the full year earnings to be $10.56 per share in 2019. This reflects 11% growth to the prior year quarter.
- The growth in earnings will likely be led by higher revenues, higher margins, and lower share count.
What’s behind Trefis? See How it’s Powering New Collaboration and What-Ifs
For CFOs and Finance Teams | Product, R&D, and Marketing Teams
Like our charts? Explore example interactive dashboards and create your own.