Is Newmont Stock A Good Bet With Gold Prices Rising?

Newmont stock (NYSE: NEM) is up 9% in the last one week and currently trades close to $74. The rally was driven by strengthening of the global gold prices. Gold prices had fallen from around $1,950/ounce at the beginning of 2021 to less than $1,700/ounce toward the end of March 2021, due to expectations of a strong dollar, higher interest rates, and faster economic recovery amidst a successful vaccine rollout. But the recent spike in Covid cases in major economies have led to fears of the second wave being worse that the first. This has led to some recent weakness in the dollar, with investors feeling that re-imposition of lockdowns will delay the economic recovery. Also, loose monetary policy across major economies is expected to continue, which would keep interest rates subdued, thus making the yellow metal more attractive. This has led to an uptick in global gold prices, which are up from less than $1,700/ounce in the beginning of April 2021 to $1,875/ounce as on 20th May 2021. Gold prices are up 3% in just the last one week. This has pushed NEM stock up as the company gets 94% of its revenue from the yellow metal. If we look at the performance of the last six months then the stock is up almost 20%.
But will Newmont’s stock continue its upward trajectory over the coming weeks, or is a correction in the stock more likely? According to the Trefis Machine Learning Engine, which identifies trends in a company’s stock price data for the last ten years, returns for NEM stock average close to 8% in the next three-month (63 trading days) period after experiencing a 9% rise over the previous one-week (five trading days) period. Notably, though, the stock is likely to outperform the S&P500 over the next three months, with an expected return which would be 3% higher compared to the S&P500.
But how would these numbers change if you are interested in holding NEM stock for a shorter or a longer time period? You can test the answer and many other combinations on the Trefis Machine Learning to test NEM stock chances of a rise after a fall and vice versa. You can test the chance of recovery over different time intervals of a quarter, month, or even just one day!
MACHINE LEARNING ENGINE – try it yourself:
IF NEM stock moved by -5% over five trading days, THEN over the next 21 trading days, NEM stock moves an average of 3 percent, which implies a return which is 1% higher than that of the S&P500.
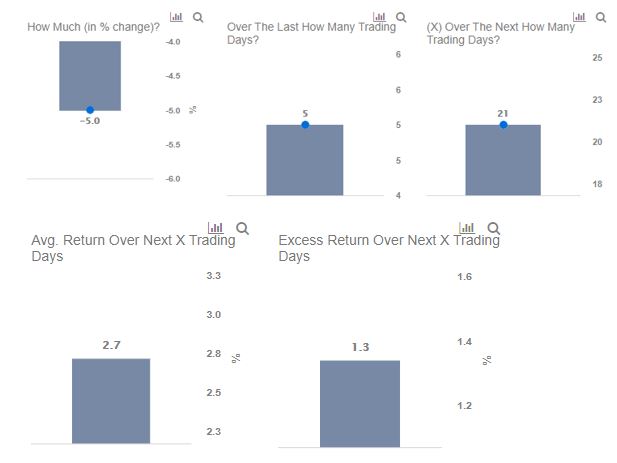
More importantly, there is 54% probability of a positive return over the next 21 trading days and 47% probability of a positive excess return after a -5% change over five trading days.
Some Fun Scenarios, FAQs & Making Sense of NEM Stock Movements:
Question 1: Is the average return for Newmont Mining stock higher after a drop?
Answer:
Consider two situations,
Case 1: Newmont Mining stock drops by -5% or more in a week
Case 2: Newmont Mining stock rises by 5% or more in a week
Is the average return for Newmont Mining stock higher over the subsequent month after Case 1 or Case 2?
NEM stock fares better after Case 1, with an average return of 2.7% over the next month (21 trading days) under Case 1 (where the stock has just suffered a 5% loss over the previous week), versus, an average return of 1.6% for Case 2.
In comparison, the S&P 500 has an average return of 3.1% over the next 21 trading days under Case 1, and an average return of just 0.5% for Case 2 as detailed in our dashboard that details the average return for the S&P 500 after a fall or rise.
Try the Trefis machine learning engine above to see for yourself how Newmont Mining stock is likely to behave after any specific gain or loss over a period.
Question 2: Does patience pay?
Answer:
If you buy and hold Newmont Mining stock, the expectation is over time the near term fluctuations will cancel out, and the long-term positive trend will favor you – at least if the company is otherwise strong.
Overall, according to data and Trefis machine learning engine’s calculations, patience absolutely pays for most stocks!
For NEM stock, the returns over the next N days after a -5% change over the last five trading days is detailed in the table below, along with the returns for the S&P500:

Question 3: What about the average return after a rise if you wait for a while?
Answer:
The average return after a rise is generally lower than after a fall as detailed in the previous question. Interestingly, though, if a stock has gained over the last few days, you would do better to avoid short-term bets for most stocks.
NEM’s returns over the next N days after a 5% change over the last five trading days is detailed in the table below, along with the returns for the S&P500:

It’s pretty powerful to test the trend for yourself for Newmont Mining stock by changing the inputs in the charts above.
While Newmont stock may have moved, 2020 has created many pricing discontinuities which can offer attractive trading opportunities. For example, you’ll be surprised how the stock valuation for Compass Minerals vs Southwest Gas shows a disconnect with their relative operational growth. You can find many such discontinuous pairs here.
See all Trefis Price Estimates and Download Trefis Data here
What’s behind Trefis? See How It’s Powering New Collaboration and What-Ifs For CFOs and Finance Teams | Product, R&D, and Marketing Teams