Key Takeaways From NASDAQ’s Q3

NASDAQ (NASDAQ: NDAQ) reported a mixed third quarter, slightly beating the consensus earnings estimate, while missing on revenue expectations. In Q3, adjusted earnings grew by 14% year-on-year (y-o-y) to $1.15, while revenue slipped by under 1% y-o-y to $600 million. The modest top line decline was largely due to the divestiture of its Public Relations Solutions and Digital Media Services businesses, partially offset by healthy organic growth and the impact of the eVestment acquisition. The company’s focus on growing its non-trading lines of business has helped it perform strongly despite stiff competition from other exchanges, leading to somewhat restricted trading volume growth. The rise in non-trading business segments – including Corporate Services, Market Technology, and Information Services – is attributable to both organic growth as well as acquisitions. The Market Services segment saw modest revenue growth (up 1% y-o-y) primarily due to favorable trading conditions, offset by an unfavorable FX impact. The company’s operating margins declined by slightly more than 2 percentage points to 41%, primarily due to higher expenses, recent acquisitions and disinvestment of its non-core businesses. We expect the non-trading segment to sustain growth momentum owing to increased demand for technological and data products, and its acquisition of eVestment should provide decent near term growth. Consequently, we forecast around 3-4% growth in NASDAQ’s non-trading revenues for the full year

We have an updated $94 price estimate for NASDAQ’s stock, which is significantly ahead of the current market price. We expect slightly over 3% growth in the company’s overall revenue for the year 2018. We have also created an interactive dashboard where you can change the company’s forecast for revenue, margins, and other key drivers to gauge how they would impact its expected results and valuation.
Non-Trading Businesses Continued Growth Due To Acquisitions, Proprietary Products
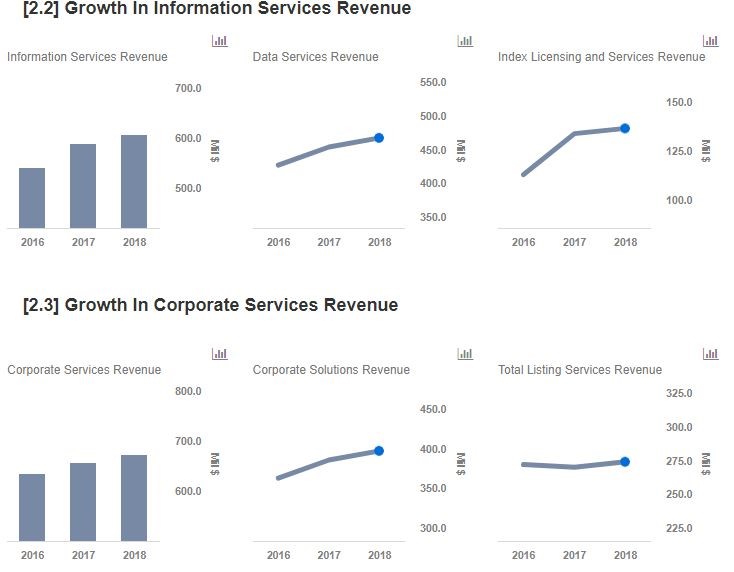
NASDAQ’s non-trading business lines generate over 60% of the company’s overall revenues. These businesses grew by nearly 12% in the third quarter. The growth in the Information Services segment was supported by organic growth from higher assets under management, acquisition of eVestment and increased adoption of its in-house products such as IR Insight and Influencer. The Market Technology segment grew organically due to increased uptake of software licensing and support, surveillance, and advisory. Increased demand for data and technology-related products and services is likely to sustain the growth momentum for these segments in the near term.
Market Services Has Grown Due To Acquisitions

The company generates about 37% of its revenue from Market Services, and the segment has grown marginally year on year. The growth due to acquisitions and improvement in the overall trading environment was partially offset by the decline in revenue capture owing to increased competition. The equity options volumes picked up pace following the acquisition of ISE, which gave NASDAQ a 39% market share in the U.S. equity options market. However, a decline in revenue per contract, driven by strong competition, offset the overall revenue growth. Cash equities and fixed income revenue saw partial growth due to higher U.S. industry trading volumes, as well as higher U.S. equities market share. Moreover, declining market shares in the cash equity and fixed income asset classes – as a result of tough competition from exchanges such as IEX – will likely offset the growth in trading commissions and provide headwinds to the top-line growth.
What’s behind Trefis? See How It’s Powering New Collaboration and What-Ifs
For CFOs and Finance Teams | Product, R&D, and Marketing Teams
Like our charts? Explore example interactive dashboards and create your own.