3M Stock To Trade Higher Post Q4?

3M Company (NYSE: MMM) is scheduled to report its Q4 2022 results on Tuesday, January 24. We expect the company to post revenue and earnings slightly above the street expectations. The company should benefit from steady demand for its healthcare and consumer offerings. However, a continued fall in demand for respirators and the strengthening U.S. dollar will likely weigh on the overall top and bottom-line expansion. We expect MMM stock to trend higher post its Q4 results. Furthermore, our forecast indicates that MMM stock has more room for growth, as discussed below. Our interactive dashboard analysis of the 3M Earnings Preview has additional details.
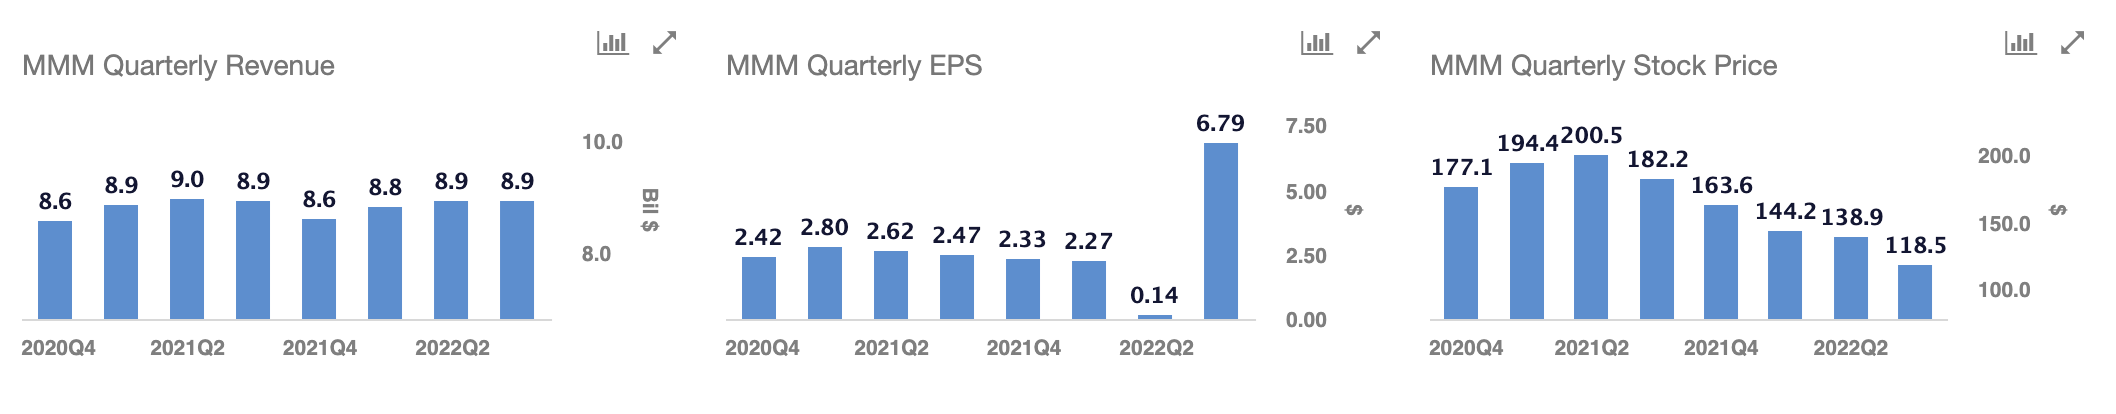
(1) Revenues expected to be above the consensus estimates
- Trefis estimates 3M’s Q4 2022 revenues to be around $8.2 billion, reflecting a mid-single-digit y-o-y decline, but above the $8.0 billion consensus estimate.
- 3M should benefit from better price realization. However, lower demand for respirators, a rise in USD, continued supply chain disruptions, and slowing economic growth are likely to weigh on the overall revenue growth.
- Looking back at Q3 2022, revenues were down 4% y-o-y to $8.6 billion, with a decline in all segments.
- Our dashboard on 3M’s Revenues offers details on the company’s segments.
- What’s Next For 3M Stock After A 15% Fall This Year?
- After A 14% Fall This Year Is 3M Stock A Better Pick Over Honeywell?
- What’s Next For 3M Stock After A 24% Fall This Year?
- Should You Pick Starbucks Over 3M Stock For Next Three Years?
- What’s Happening With 3M Stock?
- Will 3M See A Sharp Decline In Q2 Earnings?
(2) EPS likely to be above the consensus estimates
- 3M’s Q4 2022 adjusted earnings per share (EPS) is expected to be $2.40 per Trefis analysis, compared to the consensus estimate of $2.37 and the $2.31 figure the company reported in the prior-year quarter.
- 3M’s adjusted net income of $1.5 billion in Q3 2022 was up 1% y-o-y, primarily due to a 40 bps rise in the company’s operating margins.
- However, the company expects a $100-$150 million headwind from high raw materials and logistics costs in Q4.
- For the full-year 2023, we expect the adjusted EPS to be higher at $10.51, compared to $10.12 in 2021 and an estimated $10.22 in 2022.
(3) MMM stock has more room for growth
- We estimate 3M’s Valuation to be around $142 per share, which is about 20% above the current market price of $118.
- At its current levels, 3M stock is trading at just 11x its expected EPS of $10.51 in 2023, compared to the last three-year average of 18x, implying that MMM stock has ample room for growth.
- Furthermore, if the company reports upbeat Q4 results and provides a 2023 outlook better than the street estimates, the P/E multiple will likely be revised upward, resulting in higher levels for MMM stock.
- Note: P/E Multiples are based on Share Price at the end of the year and reported (or expected) Earnings for the full year
While MMM stock looks like it has some more room for growth, it is helpful to see how 3M’s Peers fare on metrics that matter. You will find other valuable comparisons for companies across industries at Peer Comparisons.
Furthermore, the Covid-19 crisis has created many pricing discontinuities which can offer attractive trading opportunities. For example, you’ll be surprised at how counter-intuitive the stock valuation is for 3M vs. AGCO.
With inflation rising and the Fed raising interest rates, among other factors, MMM stock has fallen 32% in the last twelve months. Can it drop more? See how low 3M stock can go by comparing its decline in previous market crashes. Here is a performance summary of all stocks in previous market crashes.
What if you’re looking for a more balanced portfolio instead? Our high-quality portfolio and multi-strategy portfolio have beaten the market consistently since the end of 2016.
| Returns | Jan 2023 MTD [1] |
2023 YTD [1] |
2017-23 Total [2] |
| MMM Return | -1% | -1% | -34% |
| S&P 500 Return | 2% | 2% | 74% |
| Trefis Multi-Strategy Portfolio | 5% | 5% | 231% |
[1] Month-to-date and year-to-date as of 1/20/2023
[2] Cumulative total returns since the end of 2016
Invest with Trefis Market-Beating Portfolios
See all Trefis Price Estimates