What Will Drive Lowe’s Revenue Growth Through 2021?

Trefis estimates a continuous increase in the revenue per square foot covered metric will take Lowe’s (NYSE: LOW) revenue to more than $78.8 billion by 2021. The company posted revenue of $71 billion and earnings of $2.84 for 2018.
We have created an interactive dashboard wherein you can edit the drivers to arrive at your own conclusions, How has Lowe’s revenue performed over the past few years and what is its outlook for 2021?. In addition, here is more Consumer Discretionary data.
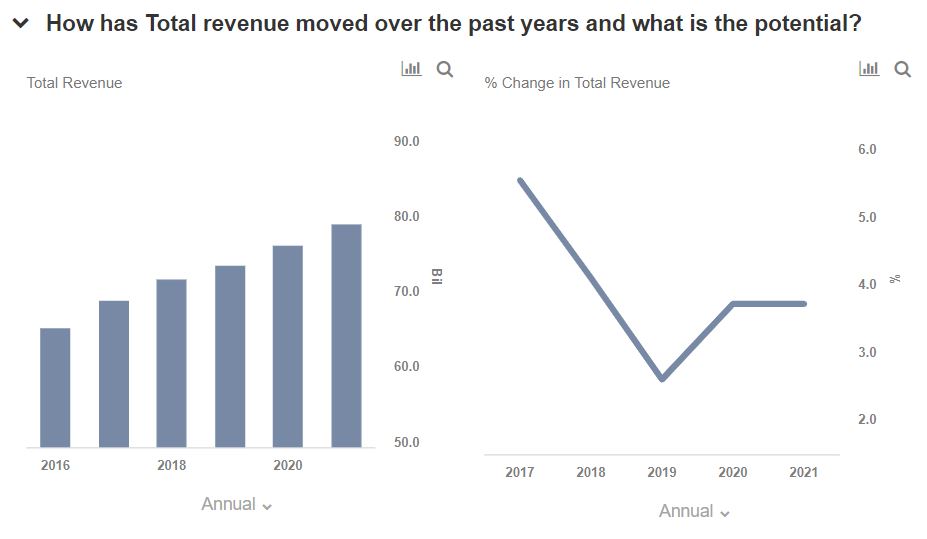
Total Revenue:
- Lowe’s has had a stable growth in revenue over the years where it has increased from $65 billion in 2016 to $71.4 billion in 2018.
- We expect the growth to continue and revenue to be more than $78.8 billion on the back of the revenue per square foot metric in 2021.
Revenue per Square Foot:
- This the fastest growing metric for the company and the one which is propelling the revenue forward. In the recent past it has increased from $305 in 2016 to $332 in 2018.
- Trefis expects the growth to remain steady and the metric to be more than $367 in 2018 due to better market conditions and growth in digital comps.
Square Footage per Store and Number of Stores:
- These metrics have remained flat in recent years as the company consolidates its operations and focuses on the existing stores and revenue growth from them.
- Trefis estimates the metrics will continue to be flat in the near term.

What’s behind Trefis? See How It’s Powering New Collaboration and What-Ifs
For CFOs and Finance Teams | Product, R&D, and Marketing Teams
Like our charts? Explore example interactive dashboards and create your own.