What’s Next For Lockheed Martin Stock After A 17% Rise In A Week?

Lockheed Martin stock (NYSE: LMT) has seen an 8% rise in a month, while it is up 17% in a week. This compares with a 0% rise for the broader S&P500 index in a month and a 5% rise in a week. The increase for LMT can be attributed to solid Q3 performance, with earnings falling above our estimates.
Lockheed Martin’s Revenue rose 3.5% to $16.6 billion, driven by an 8% rise in Aeronautics, a 7% rise in Space, 2% growth for Missiles & Fire Control, partly offset by a 5% decline in Rotary & Mission Systems. Its adjusted EPS of $6.87 reflected a 4% y-o-y growth, comfortably above our $6.78 and the consensus estimate of $6.68.
The company maintained its $65.3 billion revenue and $21.55 EPS outlook for 2022 and doesn’t expect any sales growth in 2023. However, what boded well with investors was the company’s announcement of a new $14 billion share buyback plan and its decision to increase the dividend by 7%.
- Should You Pick Lockheed Martin Stock At $430 After Q4 Beat?
- Down 20% This Year Is RTX A Better Pick Over Lockheed Martin Stock?
- After An 8% Rise In A Month What’s Next For Lockheed Martin Stock
- Which Is A Better Pick – Lockheed Martin Stock Or Starbucks?
- Why The Space Theme Is Underperforming This Year
- Here’s What We Expect From Lockheed Martin’s Q2
We have updated our model to reflect the latest quarterly results, and we now estimate the 2022 adjusted EPS to be lower at $21.79, vs. our earlier estimate of $22.34. However, we don’t see any significant upside after the recent rise in LMT stock. We estimate Lockheed Martin’s Valuation to be around $455 per share, which aligns with the current market price. At its current levels, LMT is already trading at 21x forward earnings, compared to the last three-year average of 15x.
But what about the near term?
Now that LMT stock has seen a rise of 8% in a month, will it continue its upward trajectory, or is a fall imminent? Going by historical performance, there is a higher chance of a rise in LMT stock over the next month. A move of 8% or more in a month for LMT has occurred 278 times in the past ten years. Of those instances, 150 resulted in LMT stock rising over the subsequent one-month period (twenty-one trading days). This historical pattern reflects 150 of 278 or a 54% chance of a rise in LMT stock over the next month. See our analysis of Lockheed Martin Stock Chance of Rise for more details.
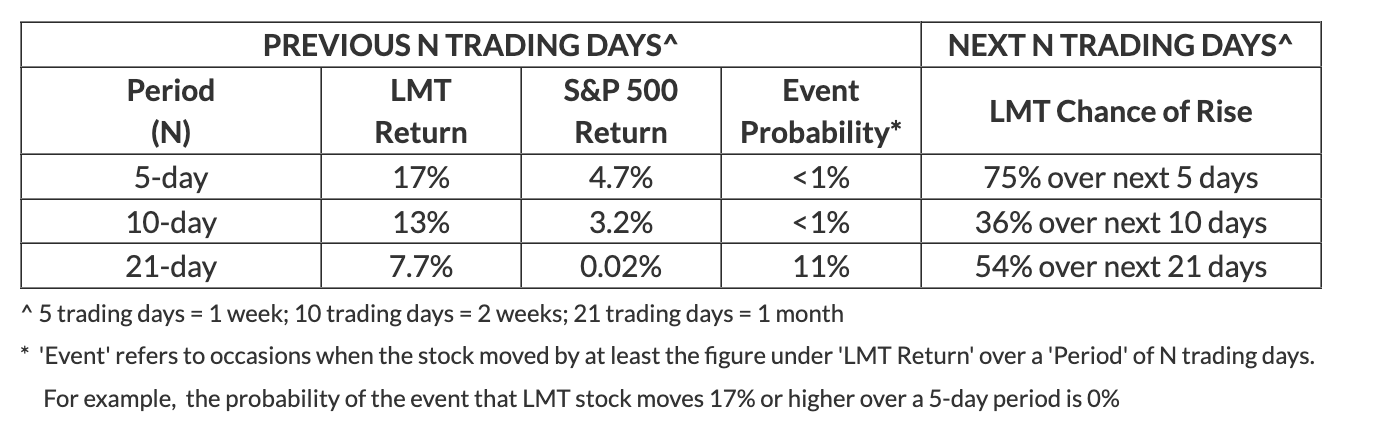
Calculation of ‘Event Probability‘ and ‘Chance of Rise‘ using the last ten years’ data
- After moving 17% or more over five days, the stock rose on 75% of the occasions in the next five days.
- After moving 13% or more over ten days, the stock rose on 36% of the occasions in the next ten days.
- After moving 8% or more over a twenty-one-day period, the stock rose on 54% of the occasions in the next twenty-one days.
This pattern suggests a higher chance of a rise in LMT stock over the next five days and next month, while it has a higher chance of a decline in the next ten days.

Lockheed Martin (LMT) Return (Recent) Comparison With Peers
- Five-Day Return: LMT highest at 16.7%; BA lowest at 6.1%
- Ten-Day Return: LMT highest at 12.5%; NOC lowest at 5.4%
- Twenty-One Day Return: LHX highest at 9.4%; BA lowest at 1.9%
While LMT stock looks like it is fully valued, it is helpful to see how Lockheed Martin’s Peers fare on metrics that matter. You will find other valuable comparisons for companies across industries at Peer Comparisons.
Furthermore, the Covid-19 crisis has created many pricing discontinuities which can offer attractive trading opportunities. For example, you’ll be surprised how counter-intuitive the stock valuation is for Aerojet Rocketdyne vs. Brink’s Company.
Despite inflation rising and the Fed raising interest rates, among other factors, LMT stock has risen 28% this year. But can it drop from here? See how low Lockheed Martin stock can go by comparing its decline in previous market crashes. Here is a performance summary of all stocks in previous market crashes.
What if you’re looking for a more balanced portfolio instead? Our high-quality portfolio and multi-strategy portfolio have beaten the market consistently since the end of 2016.
| Returns | Oct 2022 MTD [1] |
2022 YTD [1] |
2017-22 Total [2] |
| LMT Return | 18% | 28% | 82% |
| S&P 500 Return | 5% | -21% | 68% |
| Trefis Multi-Strategy Portfolio | 1% | -25% | 196% |
[1] Month-to-date and year-to-date as of 10/24/2022
[2] Cumulative total returns since the end of 2016
Invest with Trefis Market-Beating Portfolios
See all Trefis Price Estimates