What Is Johnson Controls’ Revenue Breakdown?

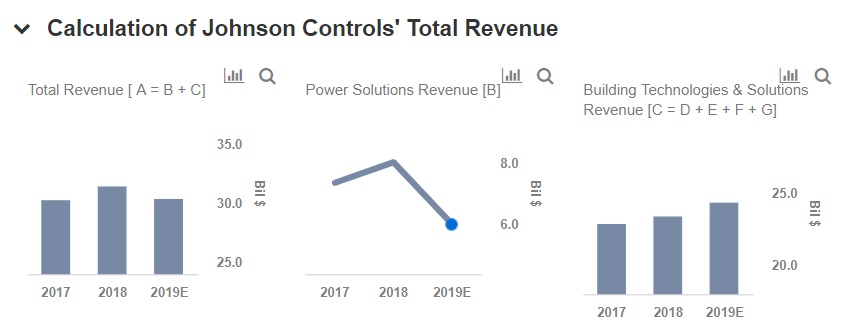
Johnson Controls (NYSE: JCI) has reported a strong Q4 in both sales and earnings to end the Fiscal Year 2018. The company had increased its focus on the Building segment which paid off as they reported revenue growth of 8% in the quarter; up 5% for the full year. The Strategic review of Power Solutions business was in its final stages when the earnings were reported. On November 13, 2018 the company announced a sale of its power solutions business for Net cash proceeds of $11.4 billion (after taxes and expenses). The company has announced that $3-3.5 billion of the said proceeds will be used towards Debt payment.
We have created an interactive dashboard on What Is Johnson Controls’ Revenue Breakdown, which details our forecasts for the company in the near term. You can modify our assumptions to see the impact any changes would have on the company’s revenue.
- Q4’23 Earnings Preview: Down 21% YTD Will Johnson Controls Stock Continue To Underperform?
- What’s Next For Johnson Controls Stock After An 8% Fall Yesterday?
- Margin Expansion To Drive Johnson Controls’ Q3?
- What’s Next For Johnson Controls Stock After An Upbeat Q2?
- Here’s What To Expect From Johnson Controls’ Q2
- Here’s What To Expect From Johnson Controls’ Q1
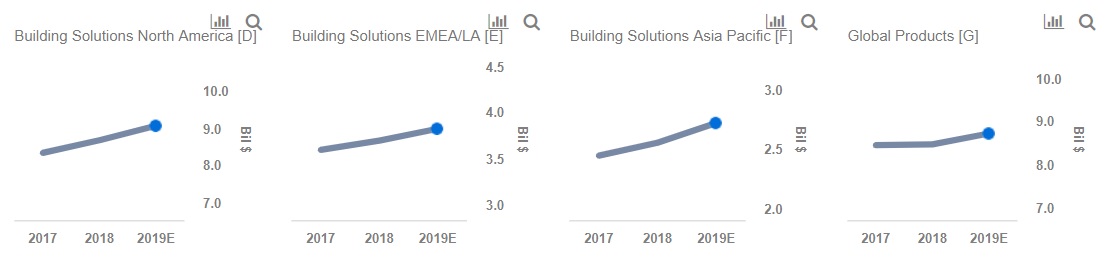
Johnson Controls is expected to generate a revenue of around $30.3 billion. The Power Solutions division sale is to be finalized by June 30, 2019 and is expected to contribute about $6 billion in sales till then. The Building Technologies and Solutions Revenue is expected to continue to grow and contribute an overall $26.3 billion in 2019. North America segment will contribute the highest at approximately $9.07 billion followed by the Global Products segment at $8.7 billion. EMEA and Latin America are expected to contribute $3.8 billion while the Asia Pacific segment contributes around $2.72 billion.
What’s behind Trefis? See How It’s Powering New Collaboration and What-Ifs
For CFOs and Finance Teams | Product, R&D, and Marketing Teams
Like our charts? Explore example interactive dashboards and create your own.