Should You Buy Intuitive Surgical Stock At $775 Levels?

Intuitive Surgical (NASDAQ:ISRG), a fast growing medical devices company, is up 30% since the start of the year and it has gained around over 2x from its March lows. We believe that Intuitive Surgical could offer an upside in the near term, as the company sees a rebound in procedure volume after disruptions due to lockdowns earlier in the year. This is likely to bolster the earnings growth rate of the company in the near term – leading to stock price growth.
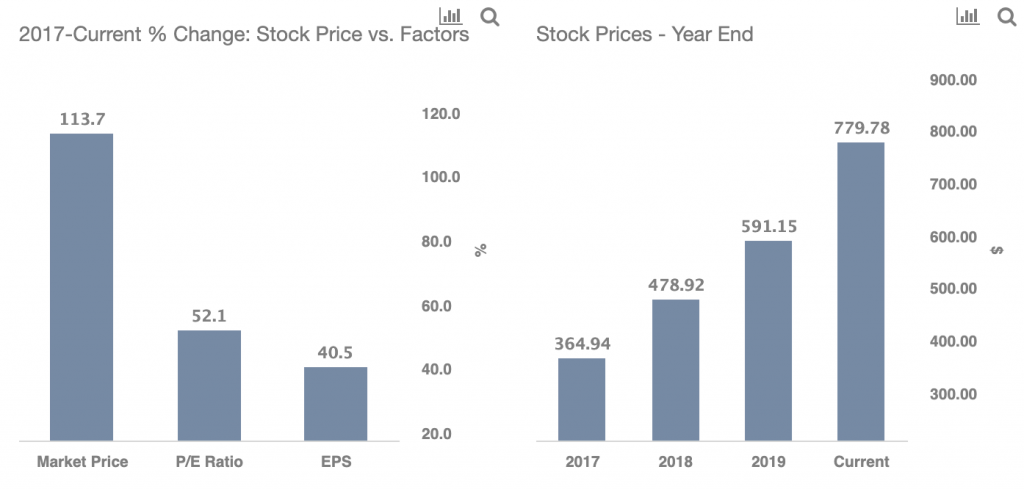
ISRG stock has rallied from $370 to $780 off the recent bottom compared to the S&P which moved 66% over the same time period. The outperformance of Intuitive Surgical can be attributed to its better than estimated earnings in Q2 and Q3. Looking at a wider time horizon, ISRG stock is up 114% from levels seen in early 2018, over two years ago. Despite the recent rally, we feel that the company’s stock has more room for growth, with the expected rise in procedures volume going forward. Our dashboard ‘Buy Or Sell Intuitive Surgical Stock provides the key numbers behind our thinking, and we explain more below.
- Should You Pick Intuitive Surgical Stock At $370?
- Should You Pick Intuitive Surgical Stock At $375 After An Upbeat Q4?
- Is Intuitive Surgical Stock A Pick After A 9% Fall In A Month Amid Mixed Q3?
- Procedure Volume Growth To Drive Intuitive Surgical’s Q3
- With 2x Potential Returns Is DexCom A Better Pick Over Intuitive Surgical?
- Here’s What To Expect From Intuitive Surgical’s Q2
Some of the stock price rise over the last two years or so is justified by the roughly 43% growth seen in Intuitive Surgical’s revenues from $3.1 billion in 2017 to $4.5 billion in 2019, and the figure is $4.3 billion for the last 4 quarters. This clubbed with Net Margin expansion of 1% from 33.7% to 34.1% on an adjusted basis meant that earnings grew 44%. On a per share basis, earnings were up 40% from $9.09 to $12.76, due to a 2.8% growth in total shares outstanding amid share issuances.
Finally, Intuitive Surgical’s P/E ratio based on trailing earnings expanded in 2019. It increased from 40x in 2017 to 46x in 2019. While the company’s P/E has now increased to 61x trailing earnings, it could see further expansion given that the earnings will likely see a strong growth in 2021 and beyond, after the pandemic, as we discuss in the section below.
How Is Coronavirus Impacting ISRG Stock?
The global spread of Coronavirus has meant there just weren’t many people visiting doctors for non-emergency cases, and several types of elective surgeries were postponed, impacting the overall sales for Intuitive Surgical, especially in Q2. That said, Intuitive Surgical has seen a rebound in procedure volume, which grew 7% y-o-y in Q3 2020. For the first 3 quarters of 2020 the company’s total revenues are actually down 5% to $3.0 billion, while its earnings were down 29% to $6.57, amid increased operating costs in the pandemic. We know that 2020 revenues and earnings are being impacted by the pandemic, but as we look forward Intuitive Surgical is expected to post strong sales and earnings growth in 2021 and beyond.
Robotic surgeries are gaining acceptance worldwide given its benefits, including less blood loss, fewer scars compared to traditional surgery, and faster recovery. The increased demand has meant Intuitive Surgical’s installed base increased from less than 4,000 units in 2016 to over 5,500 units in 2019, and we believe it will likely grow 2x over the next 5 years. The company faces negligible competition as J&J and Medtronic are still a few years away from securing FDA approvals for their robotic platforms. Also, Intuitive Surgical has no debt on its books. All these factors point toward a continuation of the rally in ISRG stock, especially now that economies are opening up and some of the countries have already begun the vaccination drive. The stock has historically traded at a P/E multiple of over 40x, and it has expanded over the recent years, a trend we believe will likely continue over the coming years, given its strong revenue and earnings growth visibility.
Looking at the broader economy, the actual recovery and its timing hinge on the containment of the coronavirus spread. Our dashboard Trends In U.S. Covid-19 Cases provides an overview of how the pandemic has been spreading in the U.S. and contrasts with trends in Brazil and Russia. Following the Fed stimulus — which set a floor on fear — the market has been willing to “look through” the current weak period and take a longer-term view. With investors focusing their attention on 2021 results, the valuations become important in finding value. Though market sentiment can be fickle, and evidence of an uptick in new cases could spook investors once again.
What if you’re looking for a more balanced portfolio instead? Here’s a high-quality portfolio to beat the market, with over 100% return since 2016, versus 55% for the S&P 500. Comprised of companies with strong revenue growth, healthy profits, lots of cash, and low risk, it has outperformed the broader market year after year, consistently.
See all Trefis Price Estimates and Download Trefis Data here
What’s behind Trefis? See How It’s Powering New Collaboration and What-Ifs For CFOs and Finance Teams | Product, R&D, and Marketing Teams