A Closer Look at Intercontinental Exchange’s Trading Revenues

Intercontinental Exchange (NYSE:ICE) is one of the largest exchange operators in the world, and runs seven cash exchanges and five futures exchanges across the globe. Since its establishment in 2000, ICE has evolved from a focus on energy trading in early 2001, to acquiring the world’s largest stock exchange (NYSE) in 2013, and finally to a focus on its data services business in 2015. The company’s stock has seen a steady increase in the last decade, growing consistently at a CAGR of 6%.
Below we take a closer look at the trading revenues of Intercontinental Exchange and how have they fared in recent years. You can view our interactive dashboard on What is Intercontinental Exchange’s Revenue Breakdown? to modify key revenue drivers, and a corresponding dashboard How have ICE’s revenues and expenses fared? to gauge the impact of changes on its stock. You can also find more of our financial services data here.
The company reports its business under two segments, namely Trading and Clearing, and Data and Listings. Per its recent 10k filings, Trading and Clearing contributed 49% of total revenues, while Data and Listings contributed 51%. These figures are different from our interactive dashboard as we do not consider the deduction of transaction-based expenses from trading revenues.
- Up 24% Since The Start Of 2023, What To Expect From Intercontinental Exchange Stock After Q4 Results?
- Up 7% In The Last One Month, Where Is Intercontinental Exchange Stock Headed?
- Where Is Intercontinental Exchange Stock Headed?
- Intercontinental Exchange Stock Is Trading Below Its Fair Value
- Intercontinental Exchange Stock To Edge Past the Expectations In Q4
- Forecast Of The Day: Intercontinental Exchange Data Services Revenue
Different Asset Classes
ICE reports its trading revenues in broadly six categories: energy futures and options, agricultural and metals futures and options, financial futures and options, cash equities and equity options, fixed income and credit, and OTC. Per the chart below, the share of trading revenues has dropped by 13% from 69% in 2015 to 55% in 2018.
Below we take a look at the different segments contributing to the trading revenues.
- Energy Futures and Options: ICE offers various global benchmark contracts such as Brent, WTI, Platts Dubai, Gasoil, Heating Oil and more. ICE Brent crude is the largest contract by volume traded on the company’s exchanges. Energy derivatives revenues have grown steadily at 5-7% year-on-year in recent years. In 2018, the flatter Brent crude futures volumes were offset by other energy futures and options which involve a higher rate per contract. This segment contributes 27% of the company’s trading revenues.

- Agricultural and Metals Futures: ICE offers futures and options contracts on agricultural commodities, primarily sugar, coffee, cocoa, cotton and metals namely, gold, silver, and iron ore. This segment’s share has grown marginally from 6.5% in 2015 to 7.2% in 2018.

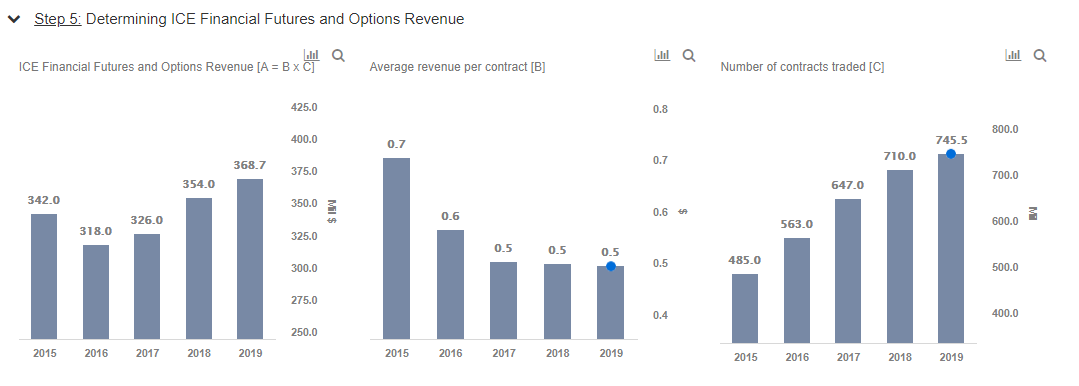
- Financial Futures and Options: ICE offers short-term interest rate derivatives, government bond derivatives, and contracts on other benchmarks such as MSCI and FTSE. Despite the 10% reduction in rate per contract in 2017, the revenue for this segment has increased steadily for the past two years driven by growth in the number of contracts traded.
- Cash Equities and Equity Options: ICE operates its equity markets prominently through the New York Stock Exchange, which has five cash equity exchange venues and two options exchange venues, all in the U.S. The revenue for this segment is driven by the share of NYSE of the U.S. equity trading market. For cash equities, NYSE’s market share has remained steady at 23-24% in the last five years. Despite the drop in market share of equity options in 2017, NYSE’s share of equity options has recovered to the historical level of 19% in 2018.

- Fixed Income and Credit: ICE offers an electronic marketplace for credit default swaps and its CDS revenues have been rising steadily at a CAGR of 14% for the past two years. Additionally, ICE offers various fixed income products on its exchanges such as ICE Bonds, TMC Bonds, ICE Credit Trade, and ICE Mortgage Services.
- OTC and Other Derivatives: These other transactions include over-the-counter derivatives primarily in the energy sector. The revenues of this segment have remained steady at around $50 million for the past 5 years.

What’s behind Trefis? See How it’s Powering New Collaboration and What-Ifs
For CFOs and Finance Teams | Product, R&D, and Marketing Teams
Like our charts? Explore example interactive dashboards and create your own