Gap Stock Has Upside Potential To Its Pre-Inflation Peak
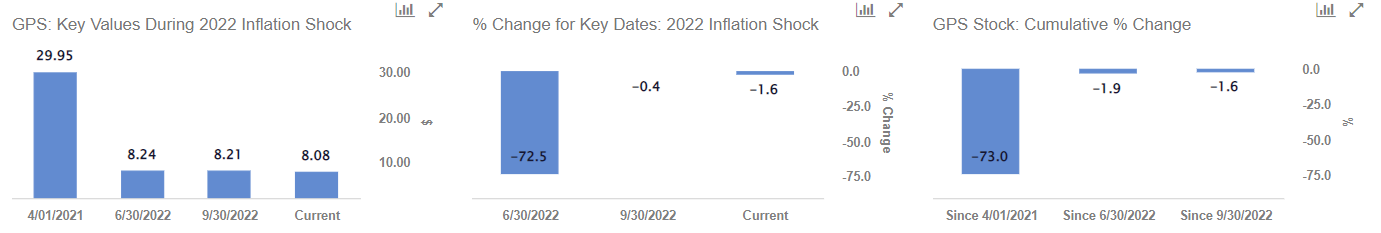
Gap Inc. stock (NYSE: GPS), a specialty retailer selling casual apparel, accessories, and personal care products for men, women, and children under the Gap, Old Navy, and Banana Republic brands, currently trades at $8 per share, around 78% below its level of $36 seen on May 17, 2021 (pre-inflation shock high), and has the potential for sizable gains. GPS saw its stock trading at around $8.21 at the beginning of October 2022, when the Fed kept increasing rates, and now remains marginally below those levels. In comparison, the S&P 500 gained about 18% during this period. Gap’s stock hasn’t seen much improvement because the retailer continues to have many headwinds, including the lack of a permanent CEO, and stagnation of its brands. The company has been without a permanent CEO since the summer of 2022. Still, the company saw a better-than-expected Q1. The company’s net sales for the fiscal first quarter of 2023, which ended in April, dropped 6% year-over-year (y-o-y) to about $3.3 billion. Gap’s net income greatly improved in Q1 compared to the same quarter of last year, although it was still in the red. In Q1 2023, it had a net loss of $18 million, whereas its net loss was $162 million last year.
Returning to the pre-inflation shock level means that Gap will have to gain about 350% from here. While it has the potential to recover to those levels, we estimate Gap’s Valuation to be around $10 per share, about 19% above the current market price. This is because the recent uncertainty in the retail sector has made investors concerned about a potential recession. Gap’s business may see an adverse impact on its volume if the U.S. economy were to go into recession, with customers holding back on discretionary purchases.
Our detailed analysis of Gap’s upside post-inflation shock captures trends in the company’s stock during the turbulent market conditions seen over 2022 and compares these trends to the stock’s performance during the 2008 recession.
2022 Inflation Shock
Timeline of Inflation Shock So Far:
- 2020 – early 2021: Increase in money supply to cushion the impact of lockdowns led to high demand for goods; producers were unable to match up.
- Early 2021: Shipping snarls and worker shortages from the coronavirus pandemic continue to hurt the supply
- April 2021: Inflation rates cross 4% and increase rapidly
- Early 2022: Energy and food prices spike due to the Russian invasion of Ukraine. Fed begins its rate hike process
- June 2022: Inflation levels peak at 9% – the highest level in 40 years. S&P 500 index declines more than 20% from peak levels.
- July – September 2022: Fed hikes interest rates aggressively – resulting in an initial recovery in the S&P 500 followed by another sharp decline
- Since October 2022: Fed continues rate hike process; improving market sentiments help S&P500 recoup some of its losses
In contrast, here’s how GPS stock and the broader market performed during the 2007/2008 crisis.
Timeline of 2007-08 Crisis
- 10/1/2007: Approximate pre-crisis peak in S&P 500 index
- 9/1/2008 – 10/1/2008: Accelerated market decline corresponding to Lehman bankruptcy filing (9/15/08)
- 3/1/2009: Approximate bottoming out of S&P 500 index
- 12/31/2009: Initial recovery to levels before accelerated decline (around 9/1/2008)
GPS and S&P 500 Performance During 2007-08 Crisis
GPS stock declined from nearly $19 in October 2007 (pre-crisis peak) to $11 in March 2009 (as the markets bottomed out), implying that GPS stock lost almost 42% of its pre-crisis value. It recovered post the 2008 crisis to levels of around $21 in early 2010, rising roughly 94% between March 2009 and January 2010. The S&P 500 Index saw a decline of 51%, falling from levels of 1,540 in September 2007 to 757 in March 2009. It then rallied 48% between March 2009 and January 2010 to reach levels of 1,124.
GPS Fundamentals Over Recent Years
GPS revenues declined from around $16.4 billion in 2019 to about $13.8 billion in 2020, due to the impact of Covid-19. However, sales rose back to $15.6 billion in 2022, as demand picked up. Earnings per share declined from around 93 cents in 2019 to a loss of $1.78 in 2020, although it improved to a loss of 55 cents in 2022. The retailer had a difficult FY 2022, with revenue falling 6% y-o-y, comparable sales down 7%, and merchandise margin down 430 basis points y-o-y.
Conclusion
With the Fed’s efforts to tame runaway inflation rates helping market sentiment, we believe Gap stock has the potential for strong gains once fears of a potential recession are allayed.
What if you’re looking for a more balanced portfolio instead? Here’s a high-quality portfolio that’s beaten the market consistently since 2016.
| Returns | Jun 2023 MTD [1] |
2023 YTD [1] |
2017-23 Total [2] |
| GPS Return | 1% | -28% | -64% |
| S&P 500 Return | 2% | 11% | 90% |
| Trefis Multi-Strategy Portfolio | 1% | 10% | 248% |
[1] Month-to-date and year-to-date as of 6/2/2023
[2] Cumulative total returns since the end of 2016
Invest with Trefis Market Beating Portfolios
See all Trefis Price Estimates