New COVID-19 Cases Nudged Lower On Monday – Is The U.S. Close To Turning The Corner?

Updated 4/7/2020
- Cumulative Coronavirus cases in the U.S. grew to 367k as of April 6. While the country reported about 30k new infections on Monday, April 6, there is a possibility that the rate of growth is slowing as daily new cases dropped from 34k on April 4.
- The 30k infections for the day translate into about 92 new cases added per million people in the country.
- Notably, Italy and Germany too have made progress in bringing down daily new cases, adding just 59 cases per million and 39 cases per million respectively on Monday, down by 40-50% compared to ~2 weeks ago.
- Per our analysis, if infections in the U.S. trend in line with Italy and Germany via increased social distancing, testing, and other measures, it’s likely that cumulative U.S. cases will peak off at levels of about 730k by early May.
- You can view our complete reasoning and modify projections to arrive at your own estimate for Total U.S. Coronavirus in our dashboard analysis Forecasting U.S. COVID-19 Cases Based On Italy & Germany’s Trajectory
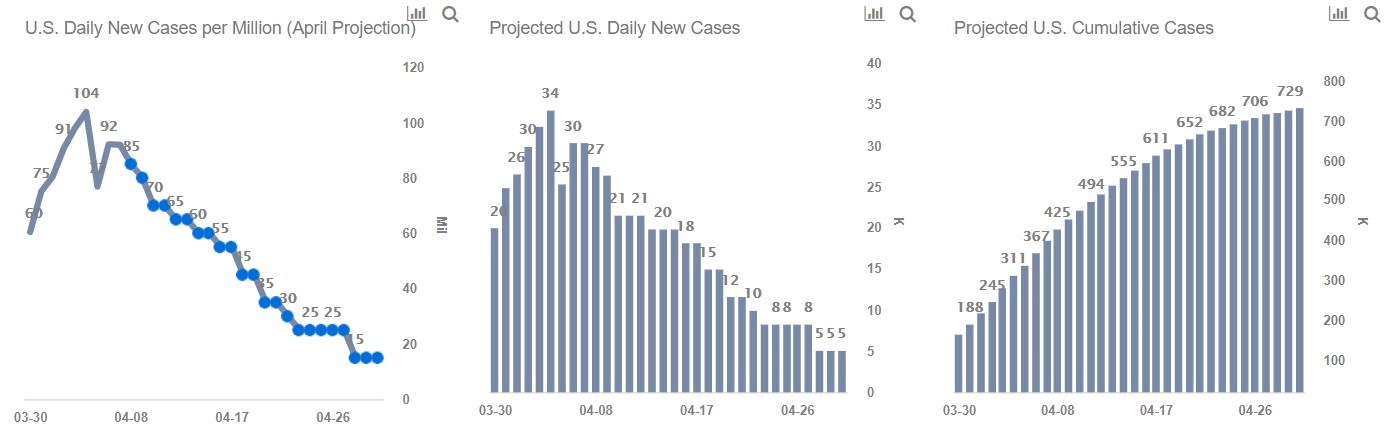
Cumulative Coronavirus cases in the U.S. grew to 367k as of April 6, adding 30k new cases on Monday, April 6 or roughly 92 new cases per million. On the other hand, Italy’s daily new cases per million have declined from about 108 in mid-March to about 59 while the number for Germany has fallen from levels of 80 daily new cases per million last week to under 40.
- Should You Pick General Electric Stock At $165?
- What’s Next For General Electric Stock After A 35% Rise This Year?
- What’s Next For General Electric Stock After 70% Gains In A Year?
- Down 20% This Year Is RTX Stock A Better Pick Than General Electric?
- Should You Pick General Electric Stock At $110 After A Solid Q3?
- After An 18% Top-Line Growth In Q2 Will General Electric Stock Deliver Another Strong Quarter?
Considering Italy & Germany’s progress, if U.S. daily new cases per million people reduce steadily to levels of 50 by mid-April and to levels of under 15 by the end of April, cumulative cases could flatten off at ~730k by early May. This translates into roughly 2,200 cases per million people by early May.
Updated 4/1/2020
- Cumulative Coronavirus cases in the U.S. grew to 188k as of March 31, as the country reported about 25k new infections on Tuesday, March 31, or roughly 75 new cases added per million people in the country.
- Notably, Italy and Germany have made progress in bringing down daily new cases over the last few days.
- Per our analysis, if infections in the U.S. trend in line with Italy and Germany via increased social distancing and other measures, it’s likely that cumulative U.S. cases will peak off at levels of about 720k by early May.
- You can view our complete reasoning and modify projections to arrive at your own estimate for Total U.S. Coronavirus in our dashboard analysis Forecasting U.S. Coronavirus Cases Based On Italy & Germany’s Trajectory.
Total U.S. Cases Could Stand At About 720k By Early May
The U.S. had a total of 188k cases in total, adding 25k new cases on March 31 alone. This translates into 75 new cases added per million people, up from about 60 new cases per million added on Mar 30. On the other hand, Italy’s daily new cases per million have declined from about 108 in mid-March to about 67 at the end of March, while the number for Germany has fallen from levels of 80 daily new cases per million last week to under 60.
Considering Italy & Germany’s recent progress, if U.S. daily new cases per million people peaks at 100 in early April and reduces steadily to levels of under 15 by late April, cumulative cases could flatten off at ~720k by early May. This translates into roughly 2,200 cases per million people by early May.
In the event that cases peak at 200 daily new cases per million in early to mid-April, and fall levels of around 120 by the end of the month, cumulative cases in the U.S. could stand at over 1.3 million by the end of the month. This translates into roughly 3900 cases per million.
Updated 3/23/2020
- U.S. cases have been growing fast, tracking Germany and Italy, where numbers have not flattened
- If the United States were to track the path of Germany, it would mean about 221,000 cases in the country using a total population of 330 million.
- On the other hand, if the U.S. tracks Italy’s trajectory, it’s possible that total cases could plateau at roughly 680,000 cases.
If The U.S. Tracks Germany Cases Might Plateau Off At ~220,000
Germany had roughly 24,500 as of March 22, adding approximately 2500 cases a day over the last two days. With a population of about 83 million, this translates to about 300 cases per million, which we believe should plateau at 670 cases per million over the coming weeks. If the United States were to track the path of Germany, with the curve flattening at 670 cases per million, it would mean about 221,000 cases in the country using a total population of 330 million.
Things Could Get Even Worse If The U.S. Tracks Italy, With Cases Reaching 680,000
Italy had roughly 60,000 as of March 22, adding roughly 5500 cases a day presently. With a population of about 66 million, this translates to about 980 cases per million, which we believe should plateau at 2000 cases per million over the coming weeks. If the United States were to track the path of Italy, with the curve flattening at 2000 cases per million, it would mean about 681,000 cases in the country using a total population of 330 million. View our complete analysis ‘Coronavirus Trends Across Countries, And What It Means For The U.S.’, which shows comparison data across countries and possible future trajectory for U.S. coronavirus cases.
Updated 3/18/2020
We added a comparison with South Korea, 8413 cases, and adding roughly 80 cases each day. With a population of about 51 million, this translates to about 164 cases per million, which we believe should plateau at 185 cases per million over the coming weeks. If the United States were to track the path of South Korea with the curve flattening at 185 cases per million, it would mean about 61000 cases in the country using a total population of 330 million.
In comparison, if the United States tracks Germany, this could mean about 76000 cases in the country due to the ongoing rapid rise in Germany. Germany has about 118 cases per million, but unlike South Korea, the daily new cases continue to climb faster than before. A total of 9367 cases were reported as of March 17, with 2000+ cases being added in a day. We believe that the number of cases in Germany will likely plateau around 230 per million – which works out to 76000 cases in the U.S. for the same trajectory.
South Korea’s testing and methods have been effective, at least so far, much like China’s – we hope the United States will learn and follow that path closely. Additional comparisons have been updated in our dashboard, which contrasts trends in coronavirus cases across countries.
3/17/2020
We compared the progression of U.S. coronavirus cases, and here’s how we saw it:
- 60 cases on February 26, or 0.2 cases per million people
- 158 cases on March 4, or 0.5 cases per million people
- 1301 cases on March 11, or 3.9 cases per million people
- 4708 cases on March 16, or 14.3 cases per million people
Note the cases per million trajectories in the U.S.: from 0.2 per million, going to 0.5, then 3.9 and 11.5 per million as of March 16, looks more like it’s closely tracking China’s path in the early days than that of countries such as Italy or Iran. For perspective, China saw cases grow from 0.4 per million for the week ended January 22, to 5.4 for January 29 and to 19.5 on February 5.
If we assume that the growth rate in U.S. cases per million follows a similar trajectory as China did, going forward, posting 110%, 27%, 5% and 2% growth in cases per million over the next four weeks, it looks likely that cumulative cases could begin to level off by the middle of April at around 13,500 considering a U.S. population of 330 million.
Our dashboard ‘Could U.S. Coronavirus Plateau At <15,000 Cases?’ shows comparison data across countries and possible future trajectory for U.S. coronavirus cases.
Why the China track?
The U.S. COVID-19 spread path to date has tracked closer to China instead of Italy. One possible reason is that measures adopted across the U.S., including school closures and social distancing, are being embraced widely at the individual family-unit level. While data in the next two weeks will be telling, this self-adopted family-unit distancing in the U.S. might be close to what China enforced, albeit somewhat less democratically.
We show in our dashboard above if the U.S. progression tracks the growth in China’s cases per million people, the number of U.S. cases is likely to start plateauing below 15,000. Such signs of successful plateauing of spread in-turn might be visible as soon as early-to-mid-April. If true, we expect that this will spur market recovery over Q2.
Our analysis of the current -28% coronavirus crash vs. 4 historic crashes compares recovery times and depth of crash across these major economic events over the last 100 years or so in detail.
Why look at cases per million, instead of just cases?
We think this is important and somewhat self-explanatory. Countries have different populations, with China close to 4 times that of the U.S. population, while Italy is much smaller than the U.S. On the other hand, much is unknown and evolving daily. If the U.S. coronavirus spread progression follows along Italy’s path, we might be looking at a spread closer to 300-400 cases per million over the coming weeks, and perhaps more since we haven’t yet seen the plateau in Italy. This will imply the number of U.S. cases racking up to over 100,000 [100 cases per million is about 35,000 cases in the U.S.]
However, plateauing doesn’t mean population-wide immunity!
Slowing down of the trajectory doesn’t necessarily mean the virus will completely go away, it merely provides a longer time horizon for communities to be more prepared to care for the sick, for therapies to develop, and ultimately even a vaccine to address the problem for good!
We think, and absolutely hope, especially if the U.S. continues to follow the family-unit-level social distancing steadfastly along with other prudent practices, a China track is quite possible. In that case, many companies ranging from P&G to United Airlines could see an upside of 20-50% and more in the medium term. As we monitor and update the forecast and comparison daily, you can follow along the updated U.S. coronavirus cases forecast and trajectory on our dashboard Could U.S. Coronavirus Plateau At <15,000 Cases?
Notes:
- Per CDC guidance illnesses that began over the last week may not be reflected yet, and the actual reported numbers may be higher https://www.cdc.gov/coronavirus/2019-ncov/cases-updates/cases-in-us.html
- Global numbers from the WHO situation reports https://www.who.int/emergencies/diseases/novel-coronavirus-2019/situation-reports/
See all Trefis Price Estimates and Download Trefis Data here
What’s behind Trefis? See How It’s Powering New Collaboration and What-Ifs For CFOs and Finance Teams | Product, R&D, and Marketing Teams