FedEx Stock Set To Outperform UPS

FedEx (NYSE: FDX) trades at about 1.0x trailing Revenues, compared to over 1.6x for United Parcel Service (NYSE: UPS). Does this gap in FedEx’s valuation make sense? While both the companies have benefited from rapid growth in e-commerce, FedEx is partly being weighed down given the impact on its earnings from challenges in integration with TNT, which it acquired back in 2016, and it has spent over $1.3 billion in expenses towards integration thus far. However, there is more to the comparison. Let’s step back to look at the fuller picture of the relative valuation of the two companies by looking at historical Revenue Growth, Returns (ability to generate profits from growth), and Risk (sustainability of profits). Our dashboard FedEx vs. UPS: Is FDX Stock Appropriately Valued Given Its lower P/S Multiple Compared to UPS? has more details on this. Parts of the analysis are summarized below.
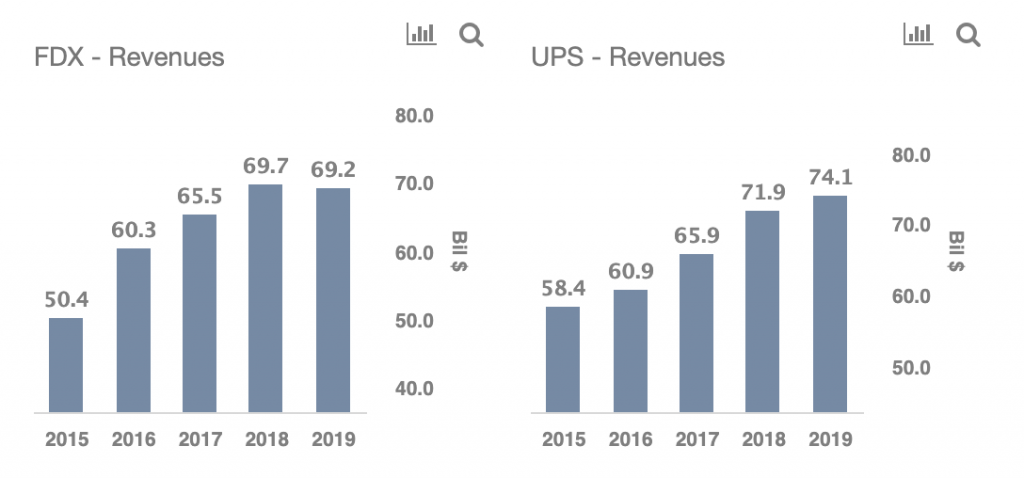
1. Revenue Growth
Between fiscal 2016 and fiscal 2020 (fiscal year ends in May), FedEx’s Revenues grew by about 37%, rising from around $50.4 billion to $69.2 billion, primarily driven by e-commerce growth and its TNT acquisition. On the other hand, UPS’ Revenues grew by about 27% between 2015 to 2019, rising from around $58.4 billion to $74.1 billion, implying FedEx’s revenues have grown at a faster pace over the recent years.
- Should You Pick FedEx Stock At $300 After Q3 Earnings Beat?
- What To Expect From FedEx’s Q3 After 20% Gains In A Year?
- Up 30% In A Year Is FedEx Stock A Better Pick Over UPS?
- With 20% Gains In A Month Is Target A Better Pick Over FedEx Stock?
- Will FedEx Stock Rebound To Its Pre-Inflation Shock Level of Over $300?
- Which Stock Is A Better Pick For The Next Three Years – FedEx Or UNH?
2. Returns (Profits)
While FedEx’s Free cash flows as a % of Revenues stood at about 7% in 2020, dropping slightly from around 11% in 2016, UPS’ Free cash flows as a % of Revenues stood at about 12%, down from around 13% in 2015. While the Return on Invested Capital metric for both companies has been volatile, FedEx’s ROIC was lower compared to UPS in 2019, standing at about 5% versus about 30%. UPS’ Total Shareholder Returns (TSR) have been higher, driven by a better stock price and growth in dividends. UPS’ stock price grew 24%, while its dividend payout ratio grew from 65% to 76% between 2015 and 2019. This compares with stock price growth of just 3% and dividend payout ratio increasing from 19% to 38% for FedEx over the same period.
3. Risk
UPS’ Debt load is slightly higher at around $26 billion currently, and its Debt to Equity ratio standing at about 25% as of 2019. FedEx’s debt currently stands at around $23 billion, increasing from $14 billion in 2016, resulting in an increase in its Debt to Equity ratio from 22% to 52%. Overall, neither company appears to have very meaningful financial risk.
The Net Of It All
Although FedEx’s Revenue growth compares favorably with UPS’ growth, partly aided by the TNT acquisition, the latter looks better from a Returns and Risk point of view. That said, we think the difference in P/S multiple of 1.6x for UPS versus 1.0x for FedEx will likely narrow going forward. Both the companies are seeing strong pickup in demand from e-commerce growth, especially after the Covid-19 spread, as more people prefer to stay at home and order goods online. While FedEx has faced challenges with the TNT integration, the company expects the full integration to be completed in 2022 with total integrations costs of $1.7 billion, out of which it has already spent $1.3 billion, implying little impact on earnings due to these costs. With FedEx’s earnings expected to grow at a faster pace compared to the growth it has seen over the recent years, the difference in P/S multiple with that of UPS is likely to narrow, implying FedEx stock could offer better growth over the coming years.
What if you’re looking for a more balanced portfolio instead? Here’s a high-quality portfolio to beat the market, with over 100% return since 2016, versus about 55% for the S&P 500. Comprised of companies with strong revenue growth, healthy profits, lots of cash, and low risk, it has outperformed the broader market year after year, consistently.
See all Trefis Price Estimates and Download Trefis Data here
What’s behind Trefis? See How It’s Powering New Collaboration and What-Ifs For CFOs and Finance Teams | Product, R&D, and Marketing Teams