How Are Facebook’s Revenues Linked To U.S. Elections?

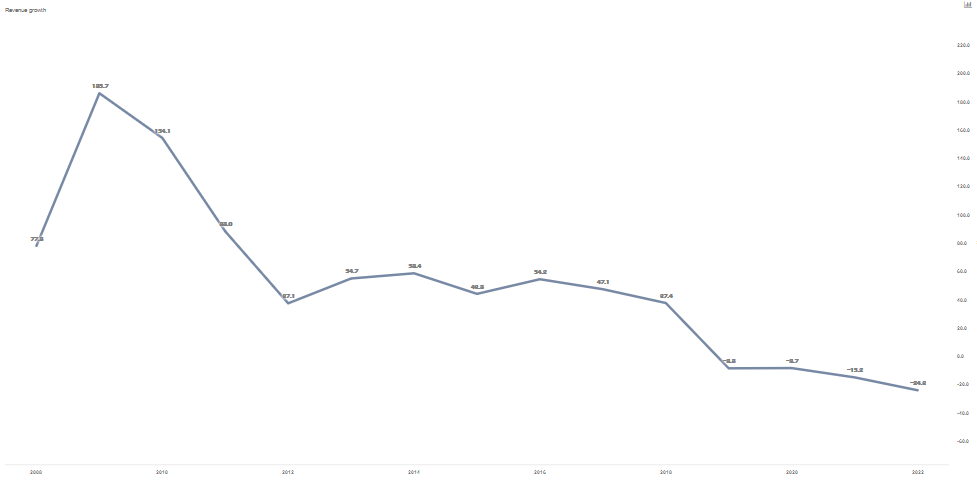
There appears to be a cyclical trend in Facebook’s (NASDAQ:FB) revenues, which appears to follow U.S. Presidential elections since 2008. Facebook was incorporated in 2004 and the company has provided revenue data since 2007, while there were U.S. Presidential elections in 2008, 2012 and 2016. The chart below outlines this trend:
Trend since 2008

- With The Stock Flat This Year, Will Q1 Results Drive SLB Stock Higher?
- Gaining Over 20% This Year, What Lies Ahead For JetBlue Stock Following Q1 Results?
- Up 8% YTD, What To Expect From Discover Financial Stock In Q1?
- Down 7.3% In A Day, Where Is Salesforce Stock Headed?
- Lululemon’s Stock Down 34% YTD, What’s Happening?
- After Nearly A 20% Rise In Six Months Will Abbott Stock See Higher Levels Post Q1?
There appears to be a reasonable level of correlation and seasonality which coincides with the election terms for the last three cycles. Also, due to the growth in Facebook’s revenues or the base effect, the overall level of growth has been trending down. Considering the characteristics of Facebook’s revenue growth, we employ the Holt-Winters method to estimate the company’s revenue based on the historical relationship with the U.S. Presidential Elections Terms.
What Is The Holt-Winters Method?
The Holt-Winters method is a statistical model of triple exponential smoothening used to forecast data series (such as monthly demand, quarterly revenue, etc) by breaking down the data in components of level (alpha), trend (delta) and seasonality (gamma). Alpha, delta and gamma are weighing parameters used to achieve the smoothening in the curve, or graph of the data series plotted. For a more detailed understanding of the Holt-Winters, this MIT lecture is a good resource.
In the case of Facebook, we find the downward trending revenue growth has been exhibiting a certain amount of seasonality (or similar changes in revenue over the 4-year presidential term) as well. Using Facebook’s revenue growth as the data series to be forecast, we initiate the Greeks (alpha, delta and gamma or the only variables in this analysis) at 0.2, which has been empirically known to be a good starting point.
Our interactive dashboard on Facebook’s Revenue Based On U.S. Presidential Elections outlines our estimates for the impact to Facebook’s revenue. You can modify any of the key drivers to visualize the impact of changes, and see all Trefis technology company data here.
The historical trend of the Facebook’s revenue appears to continue but with a decline (a phenomenon not seen since 2008). We note that this technical assessment is very different from our fundamental outlook on the company.

Given the level of impact that Facebook purportedly had on the last U.S. Presidential election, we believe it will be worth watching how the company reports its Q1 and provides its outlook for the balance of the year.
See More at Trefis | View Interactive Institutional Research (Powered by Trefis)