Key Takeaways From Ericsson’s Q1 Results

Ericsson (NASDAQ:ERIC) published its Q1 FY’19 earnings on Wednesday, reporting a stronger than expected set of results. Below, we take a look at some of the key trends that drove the company’s performance.
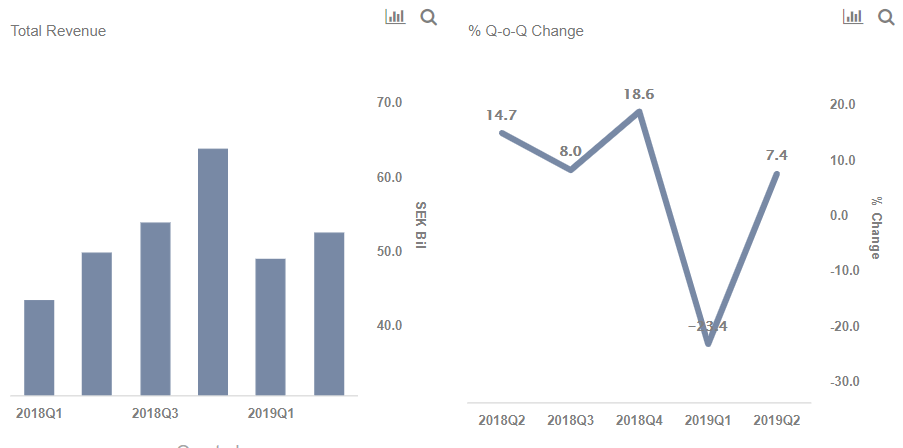
How did Ericsson fare in Q1 2019?
- Revenues grew by about 13% year-over-year to SEK 48.9 billion ($5.3 billion)
- Adjusted EPS came in at $0.09, vs. consensus of $0.05
How did the Networks business fare?
- The Networks business accounts for over 65% of Ericsson’s total revenue mix.
- Networks revenues grew ~17% year-over-year, driven by sales of 5G equipment in North America where commercial deployments are gathering steam.
- However, this was partially offset by weakness in Europe, where a lack of spectrum hurt growth.
- Ericsson now expects the Radio Access Network (RAN) market to grow by 3% in 2019, up from an earlier 2% estimate.
- Networks gross margin improved to 43.2%, up 280 bps year-over-year, driven by higher hardware capacity sales and IPR revenues.
- Down 16% This Year Amid A Weak Demand In The U.S., What Lies Ahead For Ericsson Stock?
- Is Ericsson Stock A Buy Despite Lull In North America?
- Is Ericsson Stock Good Value At $6?
- Can Ericsson Recover From Its 9.2% Drop Over The Past Two Weeks?
- Forecast Of The Day: Ericsson Managed Services Revenue
- Ericsson Stock Looks Unlikely To Sustain Its Earnings Driven Outperformance
How did the Digital Services business fare?
- Reported revenues grew by about 8% year-over-year to SEK 7.8 billion ($850 million)
- Growth is being driven by momentum for the new portfolio of 5G-ready and cloud-native products.
- While operating margins remained negative, at about –23.0%, the company is looking to turn around its operations via a revised strategy for its business support systems operations (related: How’s Ericsson’s Digital Services Business Faring?).
View our interactive dashboard analysis on How Did Ericsson Fare In Q1 2019 And What’s The Outlook Like For Q2? You can modify key drivers and arrive at your own estimates for the company’s EPS and revenues for the coming quarter. In addition, you can also see all of our data for Information Technology Companies here.
What’s behind Trefis? See How it’s Powering New Collaboration and What-Ifs
For CFOs and Finance Teams | Product, R&D, and Marketing Teams
Like our charts? Explore example interactive dashboards and create your own.