Dunkin’ US Segment Drives Revenue And Earnings Growth For Dunkin’ Brands In Q1 2019
Dunkin’ Brands (NASDAQ:DNKN) announced its Q1 2019 results on May 2, 2019, followed by a conference call with analysts. The company’s revenue beat consensus and was recorded at $319.1 million, up by 5.9% y-o-y. The revenue increase was primarily driven by a 5.5% system-wide sales growth and a 2.4% increase in comparable store sales, which was the largest quarterly comparable store sales increase in four years. The earnings beat consensus and were recorded at $0.63, up from $0.58 per share in the same period of 2018.
Dunkin’ Brands reported $1.3 billion in Total Revenues in 2018. This included 5 major revenue streams:
- Dunkin’ Donuts US: $606.8 million in 2018 (45.9% of Total Revenues). This includes royalty income from Dunkin’ Donuts stores in the US.
- Dunkin’ Donuts International: $22.34 million in 2018 (1.7% of Total Revenues). This includes royalty income from Dunkin’ Donuts stores internationally.
- Baskin-Robbins US: $47.4 million in 2018 (3.6% of Total Revenues). This includes royalty income from Baskin-Robbins stores in the US.
- Baskin-Robbins International: $115.2 million in 2018 (8.7% of Total Revenues). This includes royalty income from Baskin-Robbins stores internationally.
- Advertising Fees and related Income: $493.6 million in 2018 (37.3% of Total Revenues). The company started recognizing this separately in 2018. These are advertising fees paid on a weekly basis based on a percentage of franchisee gross sales as per the franchise agreements both in US and internationally.
- Is Dunkin’ Brands’ Stock Overvalued?
- 20% Upside For BJ’s Restaurants’ Stock When Pandemic Subsides?
- Can Dunkin’ Brands Survive A Covid Recession?
- Donuts Over Burgers: Why Dunkin’ Brands Stock Looks More Attractive Than McDonald’s
- Dunkin’ Brands Stock Looks Undervalued At $58
- Dunkin’ Brands To Meet Consensus Estimates For FY 2019?
We have summarized our key expectations from the earnings announcement in our interactive dashboard – What Has Driven Dunkin’ Brands Revenues & Expenses Over Recent Quarters, And What Can We Expect For Full-Year 2019? In addition, here is more Consumer Discretionary data.
Key Factors Affecting Earnings:
Revenue to grow:
- We see fluctuations in Total Revenue over the past few quarters but it has also shown positive growth compared to the same quarters in the previous year. In Q1 2019 the company recorded revenue of $319.1 million, up 5.9% y-o-y.
- In Dunkin’ Donuts US, we see a continuous increase in the number of outlets over the years. In 2019 expected revenue is $643.9 million. In Q1 2019 the company added 34 net new outlets.
-
Dunkin’ Donuts International had a small fall in 2017 in royalty share for the segment. Post that it has been growing both in terms of outlets and average revenue per outlet. In 2019 expected revenue is $23.3 million. In Q1 2019 the company closed down net 5 outlets.
-
Baskin-Robbins US segment has remained relatively flat in terms of revenues and the metrics thereof. Revenues have been in the range of $47-49 million since 2016 and are expected to be just above $48 million in 2019. In Q1 2019 the company closed down net 3 outlets.
- Baskin-Robbins International segment also has been nearly flat across the last few years. The growth in outlets and average revenue per outlet is offset by decreasing royalty share. In 2019 expected revenue is $118.7 million. In Q1 2019 the company closed down net 18 outlets.
Trend in Expenses:
- Total Expenses have been in line with Revenue over the past few quarters. Advertising Expense contributes the highest (around 45%) in Total expenses. In Q1 2019 it was 44.3% of Total Expenses.
- We saw a big drop in Indirect and Other expenses in 2017 due to the net tax benefit accrued as the Tax Cuts and Jobs Act was enacted. In 2019 we estimate the indirect and other expenses to be around $262.3 million.
Full Year Outlook:
- For the full year, we expect gross revenue to increase by 3.8% to $1.3 billion in 2019 led by an increase in Dunkin’ Donuts US revenues.
- The company is expected to continuously add new stores which will boost the growth. In 2019 on average we expect 450+ new outlets to open.
- EBITDA margin is expected to increase slightly to around 35.5%.
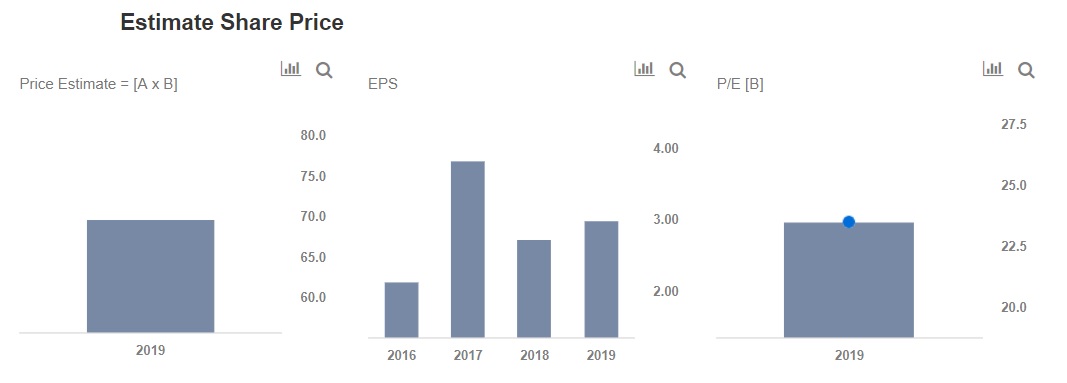
Trefis has a price estimate of $70 per share for Dunkin’ Brands stock. The value is based on the expectation that the company is on the growth path as they continue to expand reach by adding new stores in various segments across geographies.
What’s behind Trefis? See How It’s Powering New Collaboration and What-Ifs
For CFOs and Finance Teams | Product, R&D, and Marketing Teams
Like our charts? Explore example interactive dashboards and create your own.