Enter Carter Stock For 30% Gains

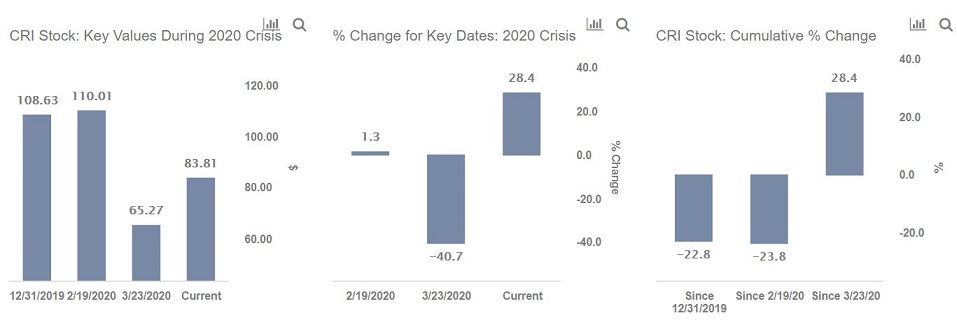
Carter stock (NYSE: CRI) currently trades near $84 and it has lost around 23% in value so far this year. It traded at a pre-Covid high of $110 in February, and it is 24% below that level now. Also, the stock has gained around 28% since its March lows of $65. Notably, Carter’s stock price has surged in recent weeks due to the strong performance of its eCommerce channel as well as a rebound in demand for discretionary products. Having said that, we believe that the stock has an upside of nearly 30% from its current level driven by expectations of improving demand and gradual store openings following the gradual lifting of lockdowns. Our conclusion is based on our detailed analysis of Carter’s stock performance during the current crisis with that during the 2008 recession in an interactive dashboard analysis.
2020 Coronavirus Crisis
Timeline of 2020 Crisis So Far:
- 12/12/2019: Coronavirus cases first reported in China
- 1/31/2020: WHO declares a global health emergency.
- 2/19/2020: Signs of effective containment in China and hopes of monetary easing by major central banks helps S&P 500 reach a record high
- 3/23/2020: S&P 500 drops 34% from the peak level seen on Feb 19, as Covid-19 cases accelerate outside China. Doesn’t help that oil prices crash in mid-March amid Saudi-led price war
- From 3/24/2020: S&P 500 recovers 56% from the lows seen on Mar 23, as the Fed’s multi-billion dollar stimulus package suppresses near-term survival anxiety and infuses liquidity into the system
In contrast, here’s how Carter and the broader market performed during the 2007/2008 crisis
2007-08 Financial Crisis
Timeline of 2007-08 Crisis
- 10/1/2007: Approximate pre-crisis peak in the S&P 500 index
- 9/1/2008 – 10/1/2008: Accelerated market decline corresponding to Lehman bankruptcy filing (9/15/08)
- 3/1/2009: Approximate bottoming out of the S&P 500 index
- 1/1/2010: Initial recovery to levels before accelerated decline (around 9/1/2008)
Carter vs S&P 500 Performance Over 2007-08 Financial Crisis
Carter stock declined from levels of around $18 in September 2007 (pre-crisis peak) to levels of around $15 in March 2009 (as the markets bottomed out), implying Carter stock lost 19% from its approximate pre-crisis peak. It recovered post the 2008 crisis, to levels of about $24 in early 2010, rising by 61% between March 2009 and January 2010. In comparison, the S&P 500 declined by 51% before recovering by 48% between March 2009 and January 2010.
Carter Fundamentals
Carter’s revenues have increased from around $3 billion in 2015 to $3.5 billion in 2019, primarily led by strong performance in the US retail and wholesale segments. Moreover, Carter’s earnings per share grew from $4.55 per share in 2015 to $5.89 in 2019. However, the company’s Q2 2020 revenues were 30% below the level seen a year ago, while the EPS figure for the quarter fell from $0.97 in Q2 2019 to $0.19 in Q2 2020.
Does Carter Have A Sufficient Cash Cushion To Meet Its Obligations Through The Coronavirus Crisis?
Carter’s total debt increased from $580 million in 2016 to $1.23 billion at the end of Q2 2020, while its total cash has improved from around $299 million to $1 billion over the same period. The company also generated $239 million in cash from its operations in the first half of 2020, and it appears to be in a good position to weather the crisis.
Conclusion
Phases of Covid-19 crisis:
- Early- to mid-March 2020: Fear of the coronavirus outbreak spreading rapidly translates into reality, with the number of cases accelerating globally
- Late-March 2020 onward: Social distancing measures + lockdowns
- April 2020: Fed stimulus suppresses near-term survival anxiety
- May-June 2020: Recovery of demand, with the gradual lifting of lockdowns – no panic anymore despite a steady increase in the number of cases
- July-October 2020: Poor Q2 results and lukewarm Q3 expectations, but continued improvement in demand, a decline in the number of new cases, and progress with vaccine development buoy market sentiment.
What if you’re looking for a more balanced portfolio instead? Here’s a high-quality portfolio to beat the market, with over 100% return since 2016, versus 55% for the S&P 500. Comprised of companies with strong revenue growth, healthy profits, lots of cash, and low risk, it has outperformed the broader market year after year, consistently.
See all Trefis Price Estimates and Download Trefis Data here
What’s behind Trefis? See How It’s Powering New Collaboration and What-Ifs For CFOs and Finance Teams | Product, R&D, and Marketing Teams