An Overview Of Costco’s Q2 And Beyond

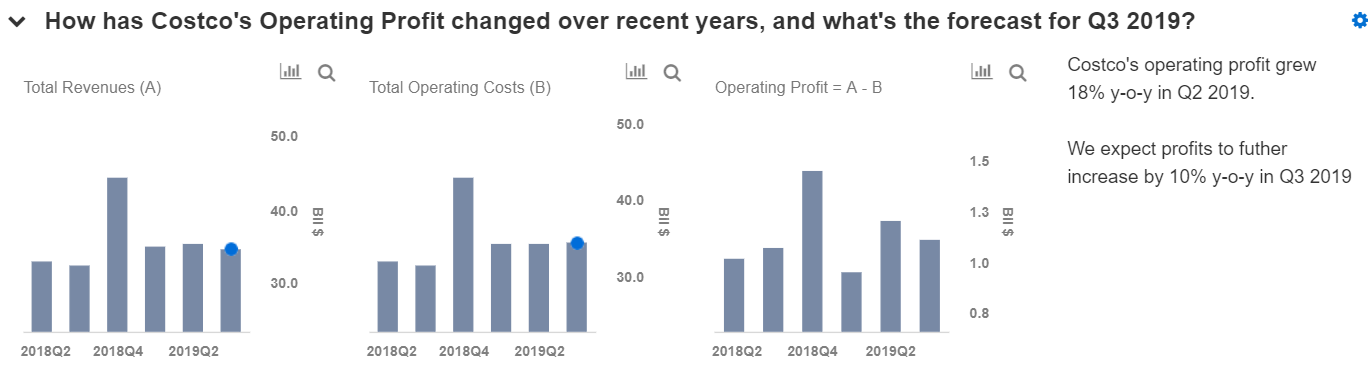
Costco‘s (NASDAQ: COST) fiscal second quarter earnings per share came in ahead of market expectations, while revenues missed. In Q2, Costco’s total revenue increased 7% year-over-year (y-o-y) to around $35.4 billion, driven by growth in membership fees and a 5% increase in comparable sales. The retailer reported net earnings of $2.01 per share, up 27% y-o-y. The results were driven by a tax benefit related to stock-based compensation and to the implementation of the tax regulation act. Our $238 price estimate for Costco’s stock is almost 10% ahead of the current market price. We have created an interactive dashboard on How Did Costco Fare in Q2, which outlines our forecasts for the company. You can change expected revenue, operating margin and net margin figures for Costco to gauge how it will impact expected EPS for the fiscal third quarter. In addition, you can also see more Trefis Consumer Discretionary company data here. We expect Costco’s revenue and earnings to continue to grow in Q3, primarily due to the company’s value offerings and high membership renewal rates, coupled with cost and productivity savings.
Growth In Comparable Sales, Membership Fees
Costco reported that its comparable store sales increased 5% during the fiscal second quarter, including the impact of gasoline prices and currency effects, largely driven by 7% comparable sales growth in the U.S., partially offset by a 0.3% decline in Canada. Excluding gasoline and currency fluctuations, combined comparable sales increased by 4%, driven by 6% growth in the U.S., offset by a 6% decline in other international markets. The top growth categories in this quarter were grocery, consumer electronics, hardware, health and beauty aids and automotive. Additionally, Costco’s growth was driven by both traffic and average transaction size growth. The company’s fiscal second quarter traffic was up 4.9% worldwide and 5.2% within the U.S. Overall, the company’s continued growth momentum confirms that it should be able to continue to see healthy traffic at its brick and mortar warehouses despite stiff competition in the grocery sector.
Costco’s membership revenue grew 7% y-o-y to $768 million, due to new sign-ups and increased penetration of the company’s higher-fee Executive Membership program. Currently, Costco’s member renewal rates are 90.7% in the U.S. and Canada and 88.3% worldwide. Meanwhile, on the e-commerce front, Costco’s online sales increased by 20% y-o-y in the quarter. And on the cost side, the company’s selling, general and administrative (SG&A) expenses increased 7% y-o-y to around $3.5 billion due to increased payroll expenses, higher IT expenditures and growth in e-commerce initiatives.
Costco has been able to consistently grow its U.S. same-store sales in recent months, even after it raised membership fees. This implies that the fee increases have not affected many customers. In fact, the retailer managed to grow its membership base to 96.3 million as of Q2, albeit at a slower y-o-y rate. We expect Costco’s membership rate to improve going forward, owing to its international expansion plans, which includes its first Chinese location in Shanghai. As of now, the company operates 30% of its total warehouses in international markets. Costco’s membership fees contribute around 17% of the company’s value, per our estimates, despite the fact that these fees account for only 2% of the company’s total revenues. Overall, Costco’s organic performance has been keeping pace with the U.S. retail industry, in large part due to its business model – which relies on low margins and high volumes. Going forward, we expect the company to report earnings of $1.82 per share and revenues of $34.7 billion, implying growth of about 7% each.

What’s behind Trefis? See How it’s Powering New Collaboration and What-Ifs
For CFOs and Finance Teams | Product, R&D, and Marketing Teams
Like our charts? Explore example interactive dashboards and create your own