Costco To Benefit From Growth In Comparable Sales In Q3

Costco (NASDAQ:COST) is scheduled to announce its fiscal third quarter results on Thursday, May 31. The company reported a relatively solid fiscal first half, with overall revenue growing 12% year-over-year (y-o-y) to around $65 billion, driven by incremental revenues from new stores, an 11% y-o-y increase in membership fees and a 9% increase in comparable sales. The company’s comparable sales were positively driven by increases in shopping frequency and average ticket, partially offset by cannibalization (established warehouses losing sales to the newly opened locations). Costco also reported net earnings of $3.04 per share, up 26% y-o-y, which included a benefit from the tax legislation passed in Q2. In addition, the company’s higher-fee Executive Memberships represented around 38% of the company’s member base in the second quarter. Currently, Costco’s member renewal rates are 90% in the U.S. and Canada and 87% worldwide.
Our $203 price estimate for Costco’s stock is slightly higher than the current market price. We have created an Interactive Dashboard which outlines our expectations for the company’s Q3 earnings. You can change expected revenue, operating margin and income margin figures for Costco to gauge how it will impact expected EPS for the current quarter. We expect Costco’s revenue and earnings to grow in Q3, primarily due to the company’s value offerings and high membership renewal rates, coupled with cost and productivity savings.

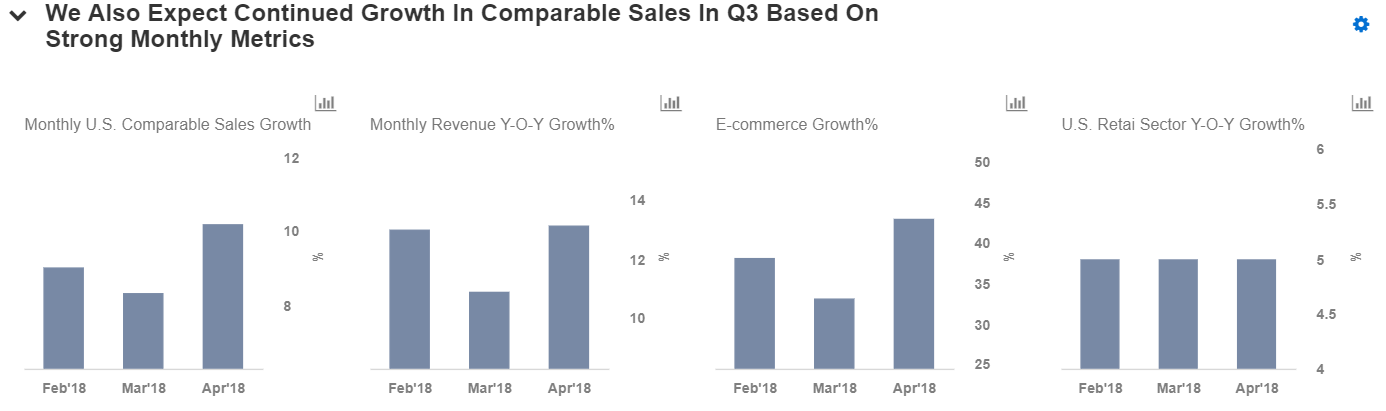
In a recent press release, Costco reported that its comparable store sales during April increased by 11%, including the impact of gasoline prices and currency effects, largely driven by a strong 10% comparable sales growth in the U.S. and 14% in Canada. Excluding gasoline and currency fluctuations, combined comparable sales increased by 7%, driven by 8% growth in the U.S., a 6% rise in Canada and 6% growth in other international markets. This growth momentum confirms that the company is still able to grow traffic at its brick and mortar warehouses despite stiff competition in the grocery sector, and growing overlap with Amazon (NASDAQ: AMZN) since it purchased Whole Foods. Given the healthy growth numbers, we expect Costco to see an increase in comparable sales in the fiscal third quarter results.

Costco has been able to consistently grow its U.S. same-store sales over last three months, even after it raised membership fees in June 2017. This implies that the fee increases have not affected many customers. In fact, the retailer has managed to grow its membership base in fiscal 2017 (ended Sep 3, 2017) to 90 million, albeit at a slower y-o-y rate. We expect Costco’s membership rate to improve going forward, as the company is preparing to open warehouses in the China market as well. As of now, the company operates 30% of its total warehouses in international markets. Costco’s membership fees contribute around 17% of the company’s value, per our estimates, despite the fact that these fees account for only 2% of the company’s total revenues. Overall, Costco’s organic performance has been keeping pace with the U.S. retail industry, in large part due to its business model – which relies on low margins and high volumes.
Going forward, we expect the company to report third quarter revenues of just over $31 billion and earnings of $1.74 per share, implying growth of about 10% and 9%, respectively. In fiscal 2018, the company plans to open nearly 23 net new warehouses, of which almost half will be located in the U.S.


For CFOs and Finance Teams | Product, R&D, and Marketing Teams
Like our charts? Explore example interactive dashboards and create your own