Gaining 125%, Capital One Stock Is Done Charging Higher

After more than a 125% gain since the March 23 lows of this year, at the current price of $99 per share, we believe Capital One Stock (NYSE: COF) has a limited upside. Capital One, the credit card giant, has seen its stock rally from $43 to $99 off the recent bottom compared to the S&P which moved around 70% – so the stock is leading the broader markets by a huge margin. The stock growth could be attributed to a Q3 2020 earnings beat and improvement in consumer spending, despite the lower interest rate environment – cumulative nine months 2020 revenues of $21.19 billion were marginally ahead of the year-ago period. However, the provision for credit losses increased to $10 billion for the nine months as compared to $4.4 billion in the year-ago period, mainly due to the higher risk of loan defaults on outstanding loans.
Capital One’s stock has partially reached the level it was at before the drop in February due to the coronavirus outbreak becoming a pandemic. This makes the COF stock fully valued, as the demand will likely be lower than last year.
The company’s revenues increased by a meager 2% over 2018-2019, however, the net income figure decreased by 8% over the same period. This was mainly due to higher compensation costs which reduced the net income margin from 21.4% in 2018 to 19.4% in 2019.
- Capital One Stock Gained 44% In The Last 6 Months, What’s Next?
- Up 40% Since The Beginning Of 2023, How Will Capital One Stock Trend After Q4 Earnings
- Up 25% Since The Beginning Of 2023, Will Capital One Stock Continue To Rally?
- Capital One Stock Gained 14% YTD And Outperformed The Estimates In Q3
- What To Expect From Capital One Stock?
- Capital One Missed The Consensus In Q1, What’s Next?
While the company has seen slow growth in revenue over 2018-2019, its P/E multiple has increased. We believe the stock is unlikely to see significant upside after the recent rally and the potential weakness from a recession-driven by the Covid outbreak. Our dashboard “What Factors Drove 31% Change In Capital One Stock Between 2018-End And Now?” has the underlying numbers.
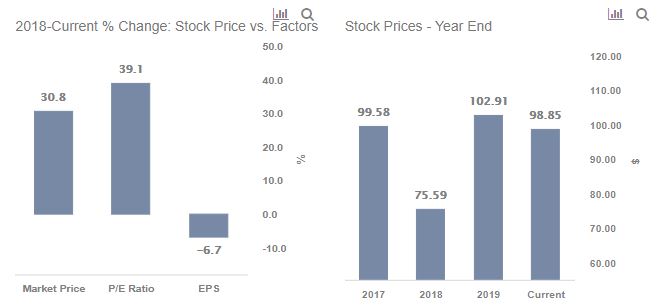
Capital One’s P/E multiple has changed from just above 6x in FY 2018 to around 9x in FY 2019. The company’s P/E has benefited from the Q3 earnings beat and is just below 9x now. This leaves limited scope for upside when the current P/E is compared to levels seen in the past years.
So Where Is The Stock Headed?
While Capital One’s top-line suffered in Q1 and Q2 2020 due to the Covid-19 crisis, the revenues bounced back in Q3 driven by a 49% y-o-y growth in non-interest income. Overall, the company’s cumulative revenues for the first nine months were marginally ahead of the previous year’s figure. That said, the consumer spending in the U.S, though improved, is still behind the pre-Covid-19 levels and the recovery is expected to take some time. Hence, Capital One’s revenues are unlikely to see significant growth in the near term. Additionally, the economic slowdown has increased the risk of loan defaults, leading to a sizable build-up in provisions for loan losses. This will further hamper the company’s growth prospects. Overall, Capital One stock has limited upside potential in the near term.
The actual recovery and its timing hinge on the broader containment of the coronavirus spread. Our dashboard Trends In U.S. Covid-19 Cases provides an overview of how the pandemic has been spreading in the U.S. and contrasts with trends in Brazil and Russia. Following the Fed stimulus — which set a floor on fear — the market has been willing to “look through” the current weak period and take a longer-term view. With investors focusing their attention on 2021 results, the valuations become important in finding value. Though market sentiment can be fickle, and evidence of an uptick in new cases could spook investors once again.
What if you’re looking for a more balanced portfolio instead? Here’s a high quality portfolio to beat the market, with over 100% return since 2016, versus 55% for the S&P 500. Comprised of companies with strong revenue growth, healthy profits, lots of cash, and low risk, it has outperformed the broader market year after year, consistently.
See all Trefis Price Estimates and Download Trefis Data here
What’s behind Trefis? See How It’s Powering New Collaboration and What-Ifs For CFOs and Finance Teams | Product, R&D, and Marketing Teams