Why Is Colgate-Palmolive’s Stock More Or Less Flat Since November 2016?

Colgate-Palmolive’s (NYSE: CL) stock has gone from $67.42 in November 2016 to $66.52 in November 2019. Over this period there has been a ~3% rise in total revenue and an equal drop in number of shares outstanding. Despite this, a drop of around 4% each in net margins and the PE multiple, has prevented the stock from providing any returns to shareholders.

View our interactive dashboard analysis- Why has Colgate-Palmolive’s stock failed to deliver returns over the last 3 years?
- Should You Pick Colgate-Palmolive Stock Over Monster Beverage After The Latter’s 2x Gains This Year?
- Should You Pick Colgate-Palmolive Stock After A Q3 Beat And 4% Gains This Month?
- Is Colgate-Palmolive Stock A Better Pick Over Marriott?
- Which Is A Better Consumer Defensive Pick – Kimberly-Clark Or CL Stock?
- Should You Buy Colgate-Palmolive Stock At $80?
- Should You Buy This Households & Personal Products Company Over Colgate-Palmolive Stock?
We break down the change in Colgate-Palmolive’s stock into 4 factors: Stock Price = (Revenue x Margins / No. of Shares) x P/E Multiple

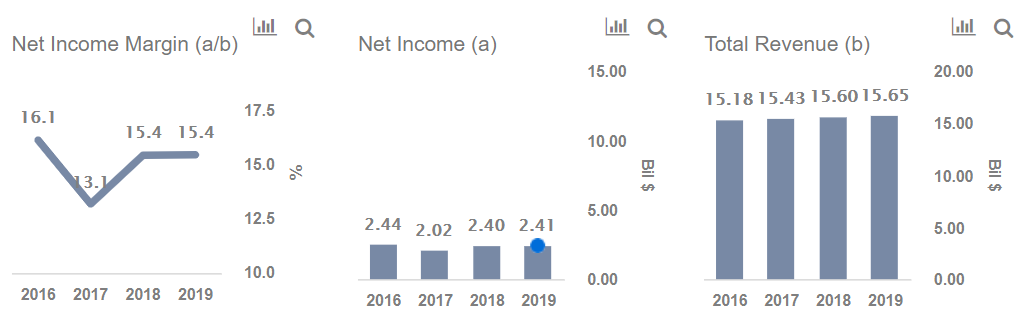
Total Revenue has grown from $15.18 billion in 2016 to $15.6 billion in 2018, and is expected to grow marginally to $15.65 billion in 2019
- Total revenue has grown almost 2.8% between 2016 and 2018, on the back of growing demand from emerging markets and we expect this trend to continue into 2019.
- For 2019, we expect revenue from Oral, Home and Personal Care to come in at about $13.24 billion, and Hill’s Pet Nutrition to make up the remaining $2.41 billion of our total revenue estimate of $15.65 billion.
- Both of Colgate’s segments have seen slow, but steady revenue growth, and with growing demand, this trend is expected to continue.

Net Margins have dropped from 16.1% in 2016 to 15.4% in 2018, and we expect it to stay around the same level in 2019
- Net Income margin dropped from 16.1% in 2016 to 15.4% in 2018.
- The drop in margins has been largely due to foreign exchange pressure, and we expect margins to be around 15.4% in 2019 as well.
How Colgate-Palmolive’s PE multiple compares with that of its peers
- Colgate-Palmolive’s trailing PE rose momentarily from 24.6x in 2016 to 30.6x in 2017, before dropping back and settling around 23.8x in 2019.
- In comparison, P&G’s trailing PE first dropped from 22.1x in 2016 to 15.2x in 2017, and then rose to 21.4x in 2018, before shooting up to around 80x in 2019, on the back of a sharp drop in EPS, owing to the write-down of the Gillette business.
- Unilever’s trailing PE on the other hand first grew from 23.8x in 2016 to 26.1x in 2017, but then gradually dropped to 14.7x in 2019.
- However, P&G has a forward PE of around 24.4x and Unilever has a forward PE of 19.7x.
- Colgate-Palmolive’s forward PE of around 22.3x seems to be in line with that of its competitors.

What’s behind Trefis? See How It’s Powering New Collaboration and What-Ifs
For CFOs and Finance Teams | Product, R&D, and Marketing Teams
Like our charts? Explore example interactive dashboards and create your own.