Why Has Chewy Stock Trended 30% Lower Since Its IPO?
Chewy (NYSE: CHWY), an online retailer of pet food and pet products, has had a mixed performance post its June IPO. While the stock jumped to about $35 per share on the day of its listing, from its IPO price of $22, it has declined by about 30% since then, trading at levels of around $25 currently. The declines are partly due to mixed earnings reports by the company. Over Q2, the company’s revenues beat estimates, growing about 43% year-over-year to $1.15 billion, although GAAP EPS fell short of expectations. Moreover, it is possible that investors could be pivoting away from high-growth and retail stocks such as Chewy considering increasing economic uncertainty. The stock could be poised for further declines considering that the IPO lock-up period is set to expire on December 11.
We ‘step back’ from these recent swings to review Chewy’s performance over the last few years, as a context for what might come next. Our Interactive dashboard, Why Has Chewy Stock Declined Post Its IPO? reviews the near term reasons and the big picture.
The context for the last few years:
- Up 7% This Year, Will Halliburton’s Gains Continue Following Q1 Results?
- Here’s What To Anticipate From UPS’ Q1
- Should You Pick Abbott Stock At $105 After An Upbeat Q1?
- Gap Stock Almost Flat This Year, What’s Next?
- With Smartphone Market Recovering, What To Expect From Qualcomm’s Q2 Results?
- Will United Airlines Stock Continue To See Higher Levels After A 20% Rise Post Upbeat Q1?
A closer look At Chewy’s Total Revenues over the last few years and the outlook
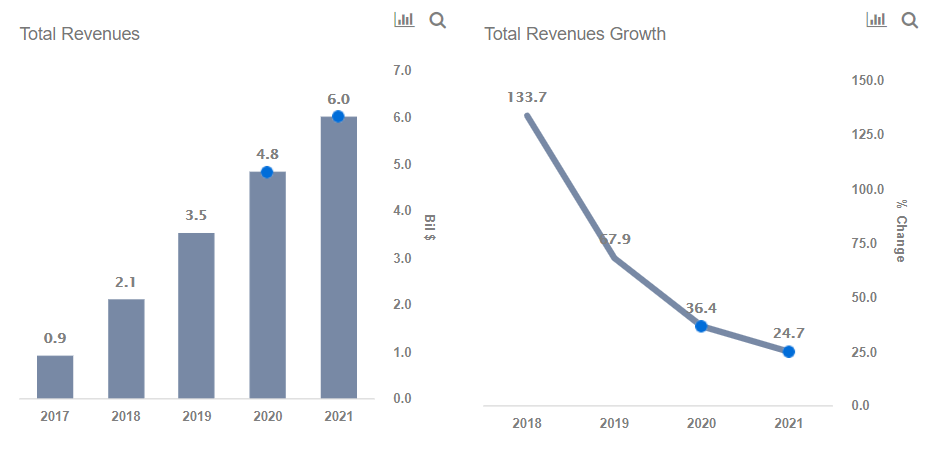
Total Revenues for Chewy increased from $2.1 Bil in 2018 to $3.5 Bil in 2019, marking an increase of 68%. This compares with Total Revenues growth of 133.7% in 2017. We expect Total Revenues growth to be 36% in 2020.
A closer look At Chewy’s Total Expenses over the last few years and the outlook
Total Expense for Chewy increased from $2.4 Bil in 2018 to about $3.8 Bil in 2019, an increase of 55.6%. This compares with Total Expense growth of 142% in 2017. We expect Total Expense growth to be 32% in 2020.
How does Chewy’s Revenue Growth compare with rivals?
For more information on how Chewy’s revenue growth compares with rivals, view our interactive dashboard analysis.
How has Chewy’s EBT trended?
EBT for Chewy improved from -$338 million in 2018 to -$267 million in 2019. We expect EBT to increase to -$180 million in 2020.
How has Chewy’s Net Income and EPS trended?
For more details on Chewy’s Net Income, view our interactive dashboard analysis.
What’s behind Trefis? See How it’s Powering New Collaboration and What-Ifs
For CFOs and Finance Teams | Product, R&D, and Marketing Teams
Like our charts? Explore example interactive dashboards and create your own.