
Bitcoin Price: Heading For The $50,000s?
Today’s big story: Could Anthropic Stock Fall 25%?
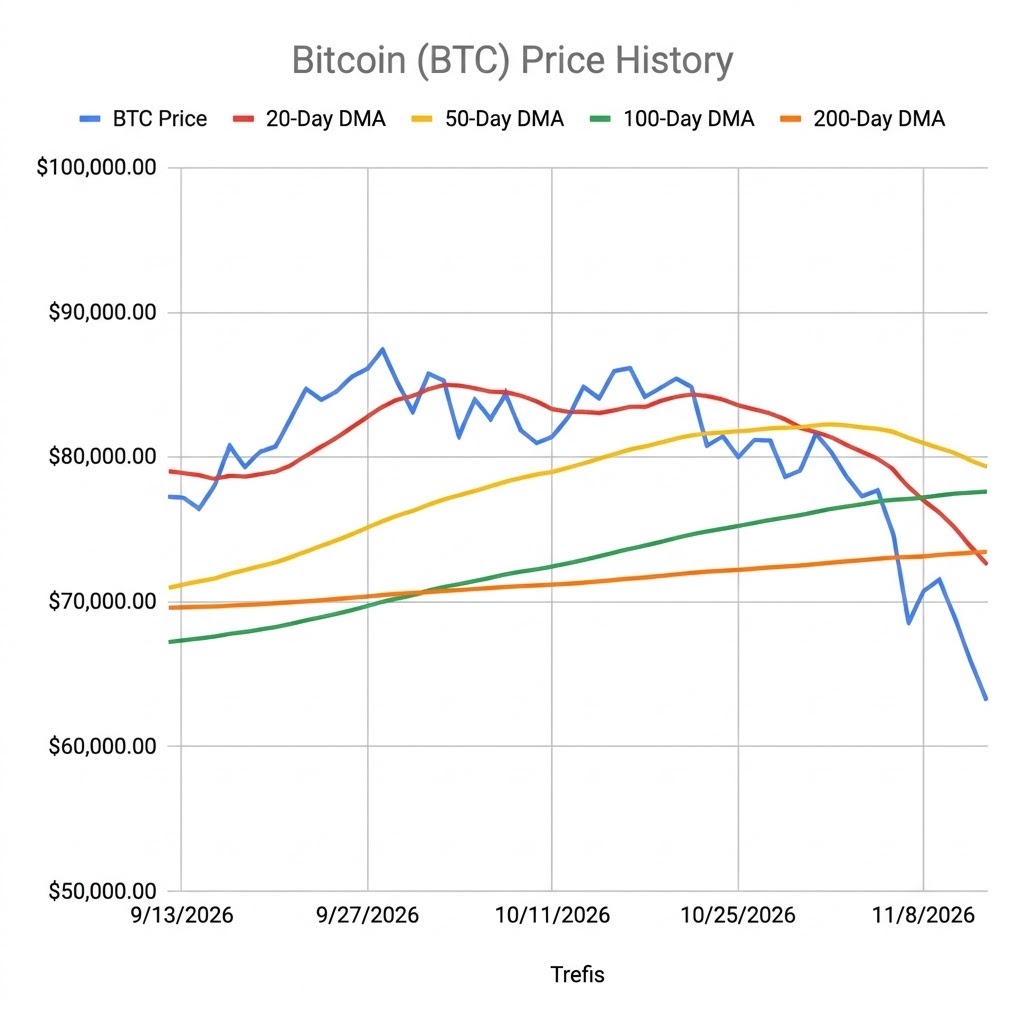
Bitcoin (BTC) peaked at $86,603 on September 21 and trades near $63,500 now – a 27% drop in 59 days. On November 16, the BTC price also slipped below its 200-week moving average of $68,000, a line that historically separates routine bull-market pullbacks from long, grinding consolidations.
But why is it falling?
It starts with interest rates. October CPI came in at 0.4% month-over-month against a 0.3% consensus, pushing CME FedWatch odds for a 25 bps hike at the December 8-9 FOMC meeting to over 95%.
At the same time, the 10-year Treasury yield climbed to 5.13%. When you can earn over 5% risk-free, holding a non-yielding asset becomes a much harder sell.
Is demand weak, too?
Yes. Institutional flows have flipped from a tailwind to a drag. US spot Bitcoin ETFs lost roughly $2.6 billion between November 2 and November 17, pulling 2026 year-to-date net flows to roughly -$1.9 billion. That puts the funds on track for their first calendar year of net outflows since launching in January 2024.
Spot demand tells the same story. The Coinbase Premium Index – which tracks US buying appetite relative to offshore exchanges- fell to its lowest 30-day average since February. It briefly turned positive over the November 15 weekend before slipping back to a discount, confirming that US trading hours are still driving the selling pressure.
What else contributed to this fall?
Leverage did the rest. Roughly $2 billion in leveraged long positions were wiped out over a single weekend, accelerating the break below $68,000. Broader tech-sector de-risking following Nvidia’s November 12 CEO transition also coincided with the drop, though direct causality to crypto outflows remains unconfirmed.
Related Read: When yields climb past 5%, markets quickly reprice anything whose payoff sits years down the road – whether in crypto or high-multiple AI. For a closer look at how timing risk affects mega-cap tech valuations, see our breakdown: Anthropic IPO: Priced For 2031, Or 2036?
How did earlier falls of 20% or more end?
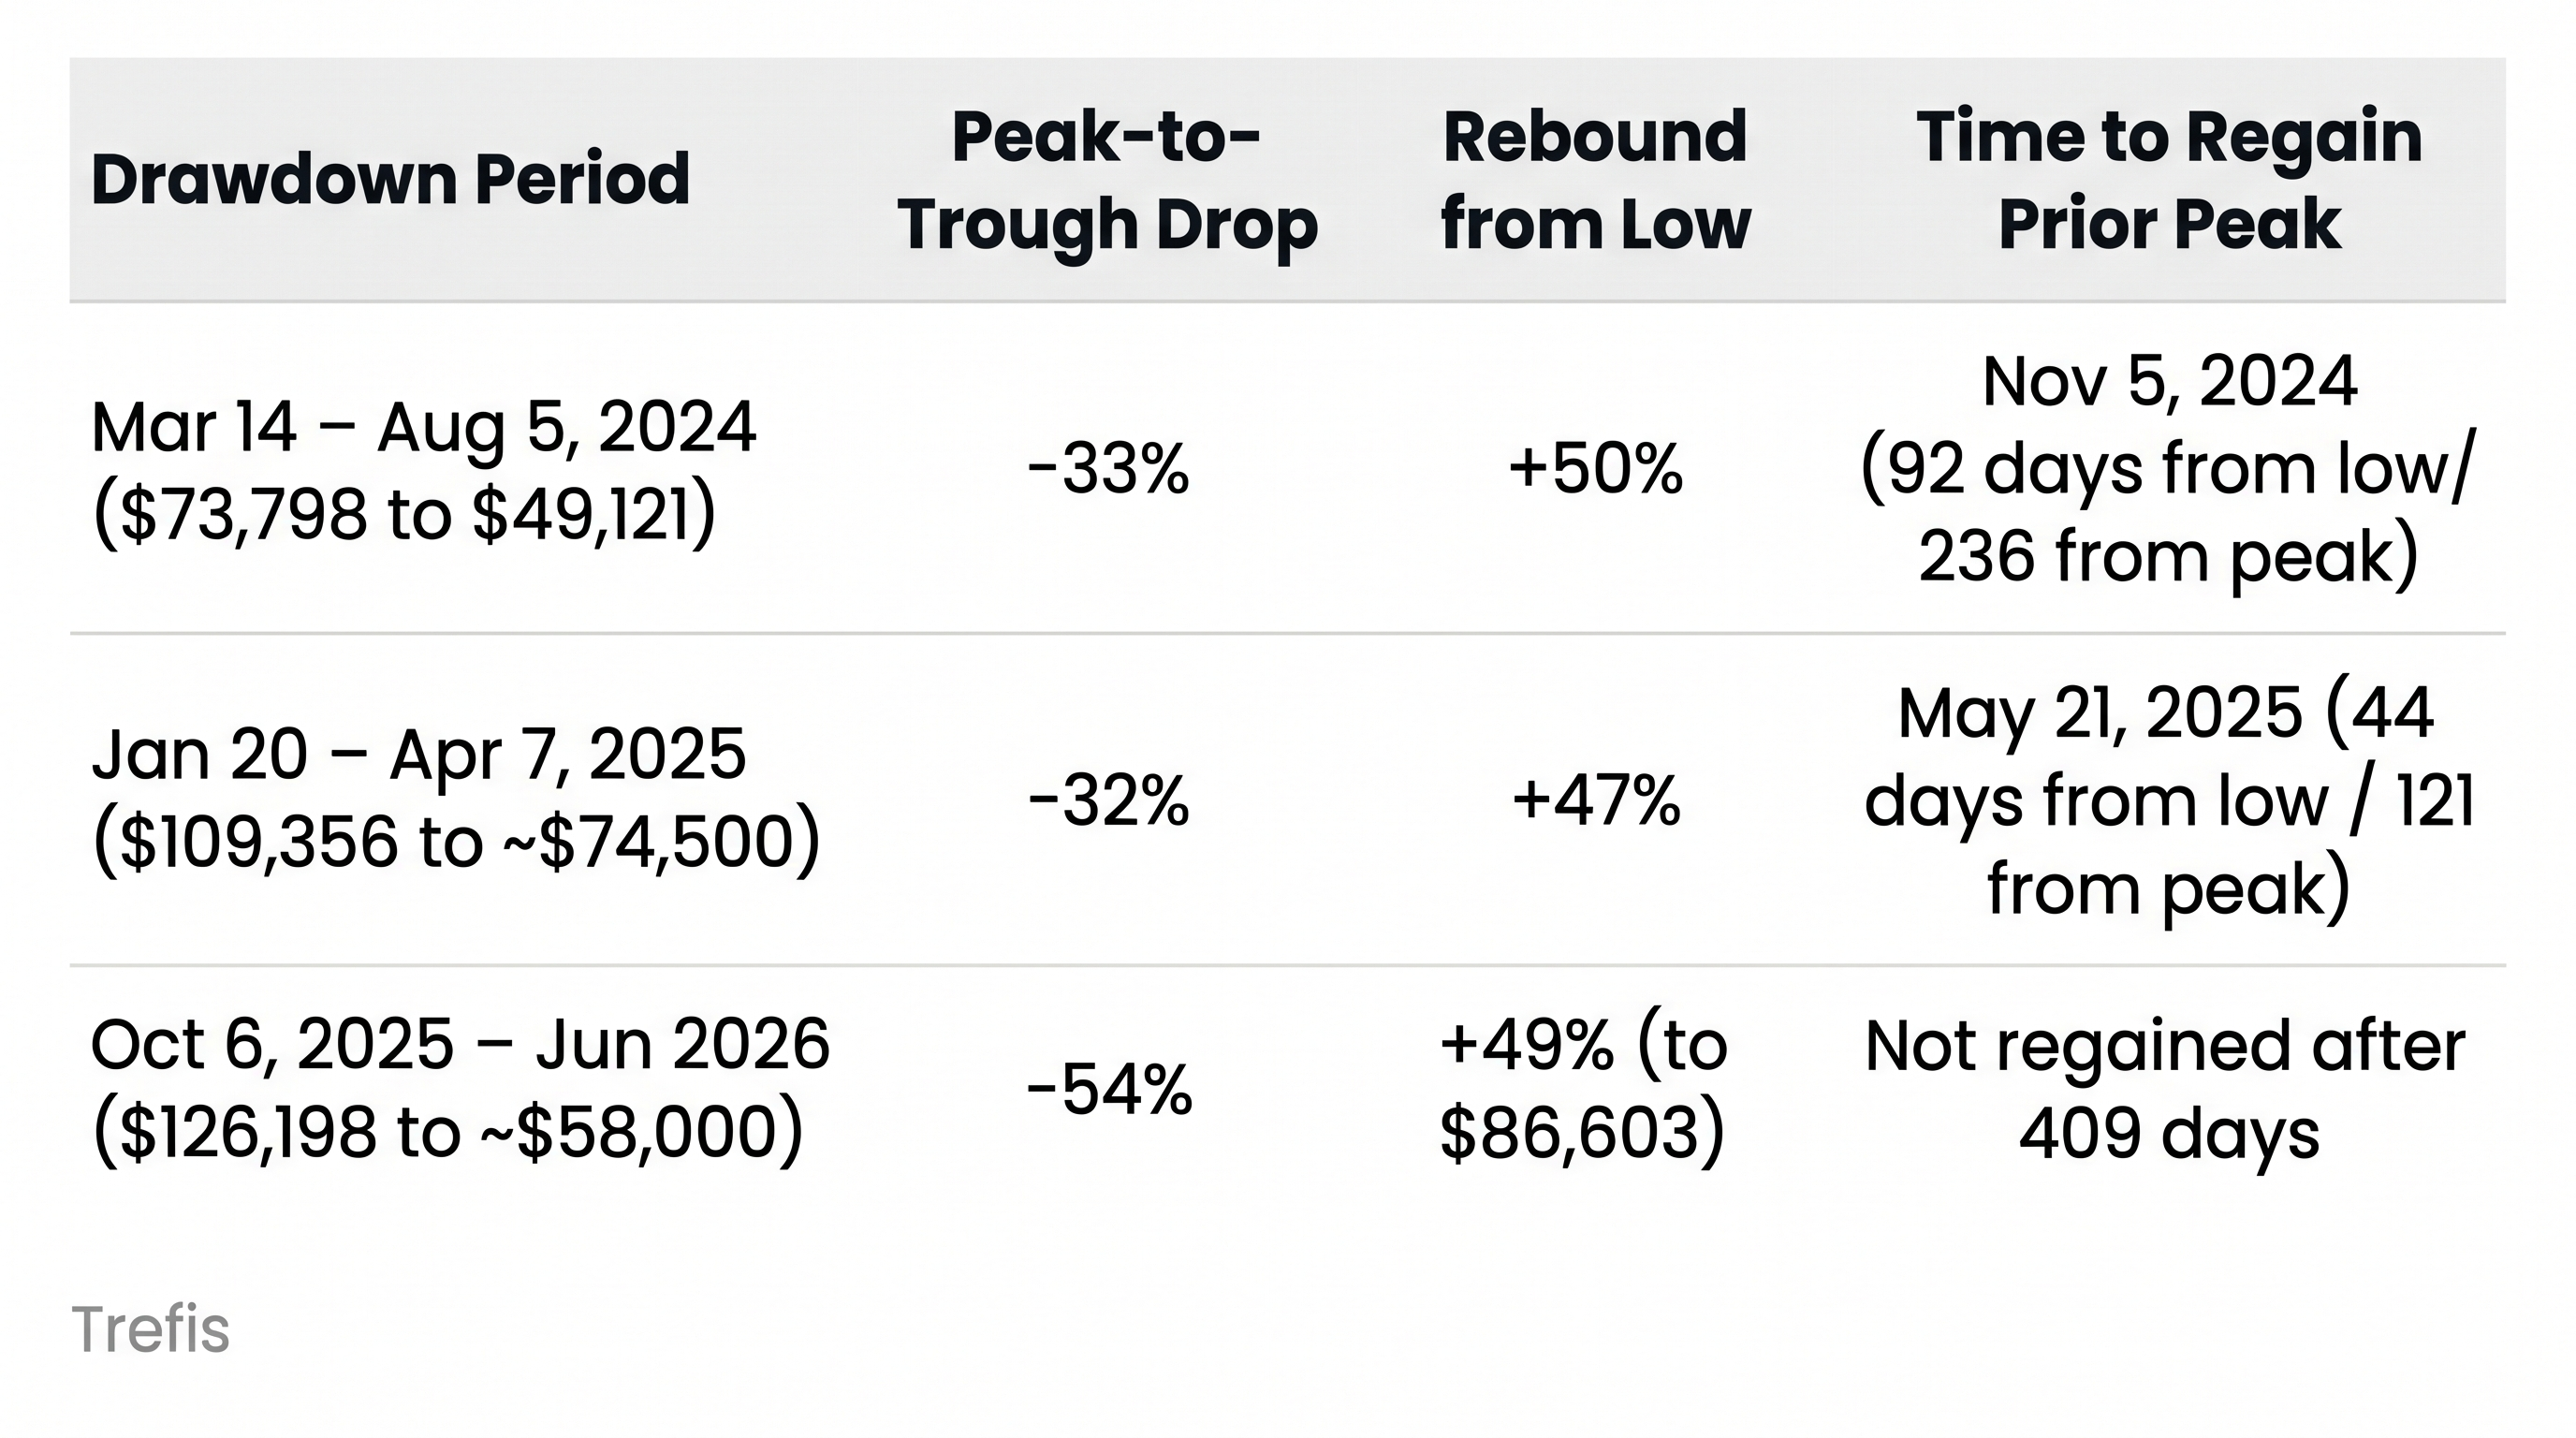
Note: That third episode also included a 39% slide from $97,860 in January to $60,074 in February that failed to hold, eventually printing a lower low near $58,000 in June.
Related Read: Steep 50%+ drawdowns and uneven recoveries aren’t unique to digital assets – even defensive blue-chip equities hit similar walls when fundamentals lag behind price rebounds. We examine a parallel setup in healthcare in Can UnitedHealth Group Stock Crash From Here?
What separated the fast recoveries from the slow one?
One thing: a macro pivot.
Both the 2024 and 2025 V-shaped rebounds followed clear policy relief – major Western central banks began cutting rates in 2024, and the US and China agreed to a 90-day tariff truce on May 12, 2025. The 2025–2026 slide had no such catalyst, which is why the February bounce off $60,000 fizzled out and retested $58,000 four months later. With the Fed actively tightening into a 5.13% 10-year yield, today’s backdrop looks far more like the slow case.
What should you expect through January?
Getting back to $86,603 takes a +36% rally. Past rebounds of 47% to 50% happened in 44 to 92 days, so Bitcoin is certainly capable of moving that fast – but every one of those runs had a catalyst that simply isn’t on the table yet.
- The Base Case ($58,000 – $68,000): Expect choppy, range-bound trading until the December 8-9 Fed meeting, boxed in by the June low ($58,000) and the broken 200-week average ($68,000). Across 92 similar drawdowns since 2010, Bitcoin was higher 20 sessions later in 60% of cases (55/92), but with a modest +3% median gain. Stabilization usually takes weeks, not days.
- The Downside Risk (Below $58,000): Because a 25 bps hike is already over 95% priced in, the real shock would be Fed Governor Waller’s floated 50 bps hike or a hawkish 2027 outlook. Wintermute warns that staying below the 200-week average opens the door to the low-$50,000s (and historically, the worst-case 20-session drop after a flush like this has been -46%).
- What Turns the Tide (Above $68,000): A genuine trend shift likely requires a daily close back above $68,000, backed by consecutive days of positive US spot ETF inflows, a recovering Coinbase premium, or Fed language that takes a January hike off the table.
The real takeaway:
Right now, $63,500 is no-man’s-land. You are sitting right in the middle of a $10,000 range ahead of a binary Fed decision, with institutional money still heading for the exits.
History shows that trying to be a hero before a macro pivot rarely pays off – just ask anyone who bought the first $60,000 bounce in February 2026. Until the Fed clears the air on December 9, the two numbers that actually matter are $58,000 (where long-term buyers will be tested) and $68,000 (where the market proves this selloff is over). Everything in between is just noise.
Riding a single volatile asset like Bitcoin means absorbing 27% swings in two months – and waiting on every CPI print or Federal Reserve meeting to dictate the next leg. That is why we lean on a diversified strategy we are proud of, and we would like to hear about a better one.
Found a better strategy? We’d love to learn.
Ours is the Trefis High Quality (HQ) Portfolio: 30 quality stocks in equal weight. Since its September 2020 launch, it has returned more than 105%, ahead of a benchmark that combines the S&P 500, S&P MidCap, and Russell 2000. If yours has done better, tell us about it. If not, come take a look.
Spot an error or want more like this? Tell us in 10 seconds.