Can Best Buy Keep Beating Expectations in Q1?

Best Buy (NYSE:BBY) is scheduled to announce its fiscal first quarter results on Thursday, May 24. We have created an Interactive Dashboard which outlines our forecasts for the company’s Q1 and expectations for its fiscal 2019 results. You can modify our forecasts to see the impact any changes would have on the company’s earnings and valuation.
Best Buy is executing on its strategy to cut costs, optimize square footage, grow online sales and stabilize its revenue stream. The company returned to real growth in fiscal 2018, with revenue growth of 7% y-o-y to around $42 billion, primarily driven by an enterprise comparable sales increase of nearly 6%. This growth followed almost flattish revenue growth in previous fiscal years. Going forward, we expect the company to benefit from its growth momentum in the first quarter as well. 
Domestic Business: Strong Growth Driver
- Flat Since The Beginning of 2023, What’s Next For Best Buy’s Stock Post Q4 Results?
- Down 15% This Year, Where Is Best Buy Stock Headed Post Q3?
- What To Expect From Best Buy’s Stock Post Q2?
- What’s Happening With Best Buy’s Stock?
- What’s Next After a 17% Fall in Best Buy’s Stock?
- What to Expect From Best Buy’s Stock Post Q2 Results?
Best Buy benefited from stronger consumer demand across most categories, particularly computing, wearables, gaming, and tablets in fiscal 2018. The retailer’s domestic segment revenue increased 7% y-o-y to $39 billion, as domestic comparable sales grew 5.6%, partially offset by the loss of revenue from Best Buy and Best Buy Mobile stores closed during this period. However, the company’s international segment revenues grew 11% y-o-y to $3.5 billion, driven by comparable sales growth of 6.3%. We expect a similar trend to continue in the first quarter as well.

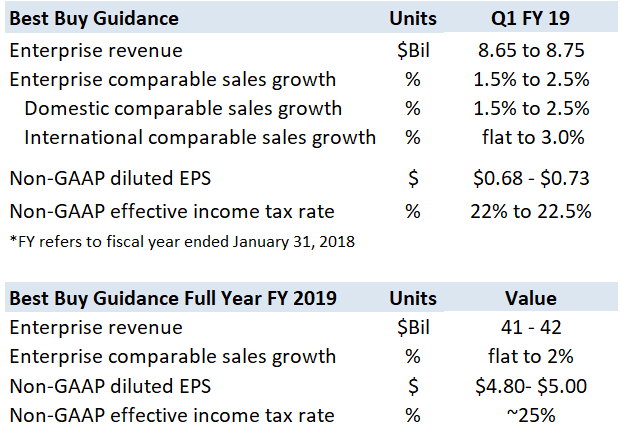
Company Guidance
For full year fiscal 2019, the company expects revenue to range between $41 and $42 billion. It should be noted that fiscal 2019 has 52 weeks as compared to 53 weeks in 2018. The company also expects full-year non-GAAP operating income growth of 7% to 9.5% versus its original outlook of 4% to 9% growth.
In Q1, the company expects its total revenue to be in the range of $8.65 to $8.75 billion. It also expects domestic comparable sales growth in the range of 1.5% to 2.5%, and adjusted earnings per diluted share of $0.68 to $0.73 for the company.


For CFOs and Finance Teams | Product, R&D, and Marketing Teams
Like our charts? Explore example interactive dashboards and create your own