Amazon’s Bull Run To Continue

Amazon’s (NASDAQ:AMZN) stock climbed more than 11% in the last 5 trading days, adding nearly $170 billion to its market cap. To put things in perspective, the increase in Amazon’s market cap in a single week was more than the magnitude of market cap of most of the firms in the S&P 500 index. Needless to say, there is always a doubt whether Amazon can sustain its incredible run. Amazon’s stock price increased 68% this year, from $1,845 to $3,100, before moving 11.1% last week, and ending at $3,443. Is there more room to grow? How might the stock perform over the next month, or 3 months, or a year? Turns out that while there may be a pull back over the next month, there is significant chance of a +10% move over the course of the next 3 months.
Our AI engine analyzes past patterns in stock movements to predict near term behavior , and suggests nearly a 42% probability of Amazon dropping 5% over the next 21 trading days. The probability of moving up by the same amount is slightly lower at 31%. However, the equation changes if we look at a larger time frame. Over the next 3 months, the chances of a 10% increase in Amazon’s stock are 42%, while chances of 10% decline are lower at 36%. Our detailed dashboard highlights the chances of Amazon’ stock rising or falling and should help you understand near-term return probabilities for different levels of movements.
Looking at the underlying fundamentals suggest that Amazon might continue to be a good long-term investment opportunity despite its significant move this year. Our dashboard Big Movers: Amazon Moved 11.1% – What Next? lays this out.
- Up More Than 100% Since The Start Of 2023, Where Is Amazon Stock Headed?
- Amazon Stock Outperformed The Q3 Estimates, What’s Next?
- Amazon Stock Is Up 50% YTD, Can It Top The Estimates In Q3?
- Amazon Stock Surpassed The Street Expectations In Q2
- Amazon Stock Is Undervalued
- Amazon Stock To Beat The Consensus In Q1
At the beginning of this year, Amazon’s trailing 12 month P/S ratio was 3.25. This figure increased 48% to 4.81, before ending at 5.35. So the stock has become increasingly expensive but there is a reason for it.
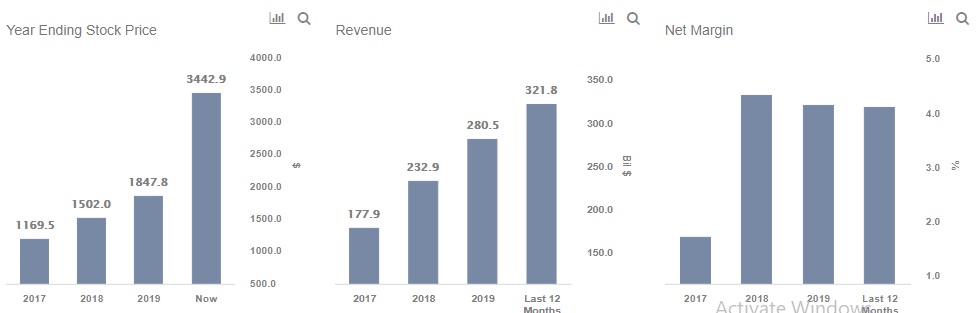
Amazon’s stock has increased 58% between 2017 and 2019, and has increased 194% between 2017 and now. The last week’s move was in-line with the long-term trend, fueled by improving financials. Amazon’s revenue has increased 57% from $177,866 Mil in 2017 to $280,522 Mil in 2019. For the last 12 months, this figure stood at $321,781 Mil despite the pandemic, implying a massive increase of 14.7% over 2019 numbers. In addition, the company’s net margins have increased 142% from 1.7% in 2017 to 4.1% in 2019. For the last 12 months, this figure stood stable at 4.1%. While the margins may appear low, it is the massive revenue base and continued growth that the market has continuously rewarded, and is likely to continue to do so.
Taking both perspectives together, it appears that Amazon could be a good medium to long-term investment. But what if you’re looking for a more balanced portfolio instead? Here’s a high quality portfolio to beat the market, with over 100% return since 2016, versus 55% for the S&P 500. Comprised of companies with strong revenue growth, healthy profits, lots of cash, and low risk, it has outperformed the broader market year after year, consistently.
See all Trefis Price Estimates and Download Trefis Data here
What’s behind Trefis? See How It’s Powering New Collaboration and What-Ifs For CFOs and Finance Teams | Product, R&D, and Marketing Teams