Why Ameritrade Is Worth $57

TD Ameritrade (NASDAQ: AMTD) has seen solid growth in the first nine months of 2018, comfortably beating revenue estimates in all three quarters, with revenue growth primarily driven by interest earning assets. With the expectation of rate hikes in the upcoming years, we expect significant growth in interest earning assets and related revenues going forward. Improvement in U.S. macro conditions, coupled with the full integration of Scottrade, should drive trading volumes and trading commissions. Further, customers seeking financial advice backed by technology-driven insights will benefit from its recently launched robo-advisory platform, which should drive Investment Product growth. We have a $57 price estimate for Ameritrade, which is slightly higher than the current market price. The various driver assumptions can be modified by accessing our interactive dashboard on Our Outlook For Ameritrade In Fiscal 2019, to gauge their impact on the company’s earnings and valuation.

We have arrived at a $57 price estimate for Ameritrade based on revenue projections of $6.3 billion for FY 2019, net income of $2 billion, and a P/E multiple of 15.
Ameritrade generates revenue from four sources – net interest income, trading commissions, investment product fees, and maintenance and service fees/other. Net interest income is generated from charges to clients on margin balances, interest earned on securities borrowings and investment securities, and investment from segregated cash. Improvement in U.S. macroeconomic conditions, coupled with interest rate hikes, should contribute to growth in the company’s interest earning asset base and yield. Ameritrade’s purchase of Scottrade in 2016 led to strong growth in brokerage’s customers and asset base, and we expect the company to see further benefits going forward. Additionally, the Scottrade deal will provide decent cost synergies which should benefit Ameritrade in the near term.
- Coronavirus Recovery Watch: Capital Market Portfolio: 15% 5D Return vs. (-25%) YTD Return – [BlackRock, E*TRADE, Schwab & TD Ameritrade]
- Why Isn’t Charles Schwab’s Stock Benefiting From The Spike In Trading Volumes?
- How Would Zero Trading Commissions Impact TD Ameritrade Revenues In 2020?
- What Would The Combined Charles Schwab-TD Ameritrade Look Like?
- Is TD Ameritrade’s Fiscal 2020 Revenue Guidance Too Optimistic?
- Did Interest Income Gains Offset Lower Trading Commissions For TD Ameritrade In Fiscal Q3?
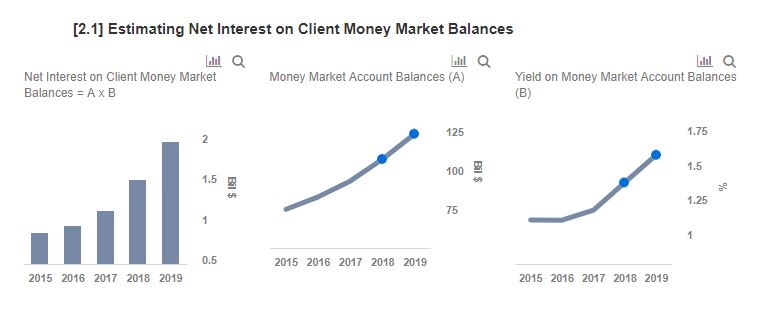

Net Interest Income accounts for about 49% of Ameritrade’s overall revenues and has been the second fastest growing segment, with 12% and 11% annual growth between 2015-2017 in interest earning assets and revenue, respectively. The robust growth was attributable to multiple Fed rate hikes, as a result of improvement in U.S. macroeconomic conditions. However, its net interest yield of 1.5%, which is relatively low in comparison to its competitors, slightly dampened the revenue growth. We expect about 12 basis points in annual yield growth, driven by interest rate hikes and an increase in demand for loans. As a result, we forecast the company’s Net Interest Income to grow by over 25% annually in the near term.

Ameritrade generates around 38% of its revenue from trading commissions, and has seen these revenues decline by roughly 1% annually between 2015-2017. The company saw restricted growth in its trading commissions as a result of continuous competition from discount brokerage with regards to pricing, and subdued macro conditions during prior years. However, the acquisition of Scottrade in 2016 drove 2017 trading volumes higher and helped to offset the losses due to declines in revenue per trade. Improvement in U.S. economic conditions, reduced trading commissions and the integration of Scottrade should drive robust growth in trading volumes in the near future. Consequently, we forecast the company’s trading commissions to grow by nearly 33% year-on-year.
What’s behind Trefis? See How It’s Powering New Collaboration and What-Ifs
For CFOs and Finance Teams | Product, R&D, and Marketing Teams
Like our charts? Explore example interactive dashboards and create your own.