AMD vs Intel: A Detailed Comparison of Revenue And Key Operating Metrics

AMD (NYSE:AMD) and Intel (NASDAQ:INTC) both manufacture and market microprocessors used in servers, desktop PCs, and notebooks. Additionally, AMD manufactures Graphics Processor Units (GPUs), which are used in PCs to process information for graphics displays. While Intel has been the market leader in the segments it operates, of late AMD has seen strong growth, especially in the desktops and notebooks market. In this note we compare AMD and Intel’s revenues and key operating metrics. You can look at our interactive dashboard analysis ~ Intel vs. AMD: How Have Revenues & Key Operating Metrics Changed Over Recent Years? ~ for more details. In addition, you can see more of our data for information technology companies here.
How Have Total Revenues For Intel And AMD Trended Over The Last 5 Years?

- Intel’s revenues have grown from $55.9 billion in 2014 to $70.8 billion in 2018, primarily led by its data center group.
- AMD’s revenue have grown from $5.5 billion in 2014 to $6.5 billion in 2018, primarily led by its computing & graphics segment.
- Digital Infrastructure Stocks Are Up 7% This Year, Will Generative AI Tailwinds Continue To Drive Them Higher?
- Up 130% In The Last 12 Months, Will AI Power AMD’s Rally Post Q4 Results?
- AMD Takes The Fight To Nvidia With Latest AI Chip Launch. Is The Stock A Buy At $116?
- Is AMD Stock A Buy At $120 As It Doubles Down On AI-Focused GPUs?
- Is AMD The Dark Horse Of The AI Silicon Race?
- What To Expect From AMD’s Q2 Results?
Both Intel And AMD’s Revenues Gave Grown At A Similar Average Annual Rate

- Both Intel and AMD’s average annual revenue growth was similar between 2014-2018.
- Intel’s revenues grew at an average annual rate of 6.2% , while that of AMD grew at 6.4%.
China Accounts For Most of The Revenues For Both Intel And AMD

- Looking at a geography-wise breakup of revenues, we find China, including Taiwan, accounts for most of the revenues for both Intel and AMD.
- Intel’s region-wise contribution as of 2018:
- China (And Taiwan): 42%
- United States: 20%
- Singapore: 22%
- Others: 16%
- AMD’s region-wise contribution as of 2018:
- China (And Taiwan): 39%
- United States: 21%
- Singapore: 11%
- Japan: 19%
- Europe: 7%
- Others: 3%
Average Revenue Per Employee Has More Or Less Trended Similar For Intel And AMD


Of Late, AMD Has Been Gaining Share From Intel In the CPU Market
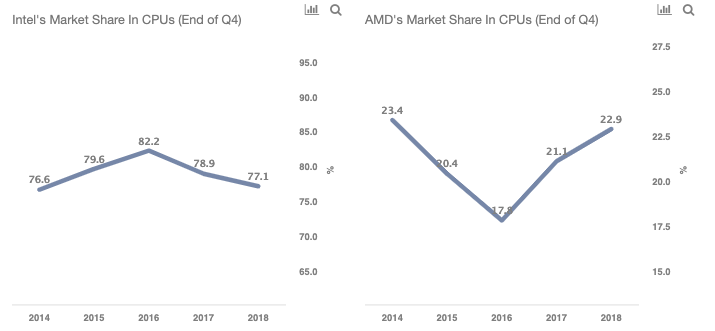
- Intel controls most of the CPU market with its share growing from 77% in 2014 to 82% in 2016, and back at 77% in 2018.
- AMD’s share fell from 23% in 2014 to 18% in 2016, but it has been on a rise since then to 23% in 2018.
- In fact, if we look at Q3 2019 numbers, AMD’s share stands at 32%.
- This can be attributed to the success of its Ryzen processors, which offer comparable performance for a cheaper price when compared to Intel.
- Of late, there has been a shortage of Intel’s chips for CPUs, as the company has been focused on ramping up its production to meet the demand for its data center business. This also benefited AMD, as many OEMs started offering Ryzen processor based desktops and notebooks.
Intel’s Gross Profit Margin And Adjusted Net Income Margin Have Been Higher Than That of AMD

- When it comes to profitability, Intel clearly beats AMD. Intel’s gross profit margin has fluctuated in the range of 61% to 64%.
- This compares with AMD’s range of 22% and 38%.

- Looking at adjusted net income margin, Intel saw the margins grow from 23% in 2014 to 30% in 2018.
- AMD posted an adjusted loss in 2015 and 2016. AMD’s net income margin stood at 2% in 2014, and it has grown in the recent years to 8% in 2018.
What’s behind Trefis? See How it’s Powering New Collaboration and What-Ifs
For CFOs and Finance Teams | Product, R&D, and Marketing Teams
Like our charts? Explore example interactive dashboards and create your own.