How Steep Increase In Profit Margins Has Driven Visa’s EPS Growth


Visa’s profit margins in 2015 have grown considerably compared to its margins in 2012. Earnings per share has also grown because of this. Since, 2012 was an outlier in terms of financial performance for Visa, since it incurred an unusual expense item of $4 Billion in 2012, compared to $18 Million, $453 Million and $14 Million only in the subsequent years, this comparison seems over inflated. However, if we make the same comparison over the 2013-2015 period, we still see the same pattern of profit margin growth driving EPS growth.
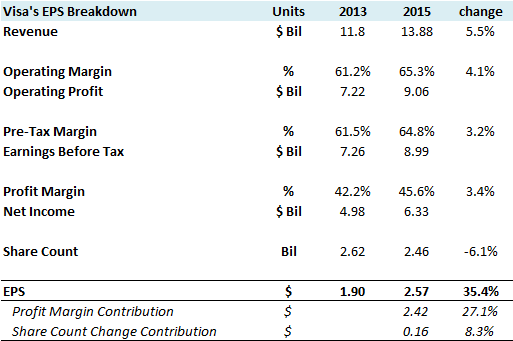
As we can see from the table above, even though revenue has grown at just 5.5% annually, EPS grew by over a third in the same period, nearly double the growth rate of revenue. While some of this(8 percentage points) was contributed by share buybacks, most of this growth came from increasing margins.
Have more questions about Visa? See the links below:
- How Much Did Visa’s Revenue & Gross Profit Grow In The Last Five Years?
- How Much Can Visa’s Revenue Grow In The Next Five Years?
- What Is Visa’s Fundamental Value Based On Expected 2016 Results?
- How Has Visa’s Revenue Composition Changed In The Last Five Years?
Notes:
Global Large Cap | U.S. Mid & Small Cap | European Large & Mid Cap |More Trefis Research