How Will Lower Fuel Costs Impact The Aircraft Re-Fleeting Program Of Large US Airlines?

Plummeting crude oil prices have resulted in a notable drop in the jet fuel costs of US Airlines, which has enabled them to move out of the heavy losses that they once suffered. Most of the airlines’ EBITDA grew by roughly 30% on an average due to these notable fuel cost savings. Apart from expanding the profitability, this has also significantly improved the cash flows of these large airlines. In order to utilize this excess cash flow, the US airlines have spent a considerable amount to revamp their existing fleet of aircraft, by purchasing newer, larger, and more fuel-efficient aircraft. For instance, the three largest US airlines — American Airlines, Delta Air Lines, and United Continental — increased their capital spending by 27% on an average in 2015 compared to 2014. The higher capital spend is enabling these airlines to create a younger and more fuel-efficient fleet of aircraft while the fuel costs are still favorable.
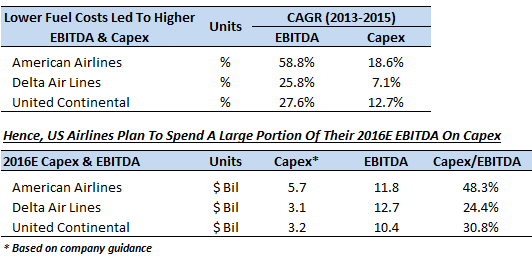
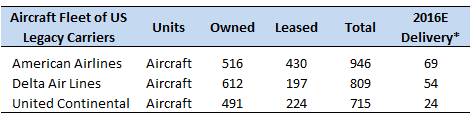
Due to the persistently low fuel costs in the first quarter of 2016, these network carriers aim to further improve their aircraft fleet in 2016 and spend a notable portion of their EBITDA to finance their capital spending. The top 3 US airlines target to spend approximately 35% on average of their EBITDA to re-fleet their aircraft in 2016 and expect to receive deliveries of about 150 aircraft in total during the year.
- Spurred By Stellar Earnings, Can United Airlines Holdings Stock Extend Its Run?
- United Airlines Holdings Stock Looks Set For A Come Back
- Down 13% Last Week, Can United Airlines Holdings Stock Bounce Back?
- Is United Airlines Stock On The Move?
- Company Of The Day: United Airlines
- Will United Airlines Stock Rise After Recent Correction?
Even though this trend will work in the favor of the US Airline industry in the short term, it will not be sustainable for these airlines to maintain such a high capital budget once the commodity prices recover. Hence, over time when crude oil prices rebound and jet fuel costs increase, the EBITDA of these airlines is likely to come down. Consequently, these airlines will be forced to cut down their capital spending. We present our forecast for the EBITDA and Capital Spending of these airlines over the next few years in the table below.

Overall, we believe that the lower fuel costs have allowed US Airlines to create a cost-efficient fleet of aircraft, which will help them to compete among themselves and preserve their margins even after the oil markets rebound eventually.
Have more questions about United Continental (NYSE:UAL)? See the links below:
- How Have Mergers And Acquisitions Led To The Consolidation Of The US Airline Industry Over The Last Decade?
- Lower Unit Revenue And Higher Tax Expense Caused United Continental’s 1Q’16 Earnings To Drop Despite Fuel Cost Savings
- Currency Headwinds To Offset United Continental’s Fuel Cost Savings For 1Q’16
- How Will United’s Equity Value Be Impacted If The Crude Oil Prices Rebound To $100 Per Barrel By 2018?
- How Will United’s Equity Value Be Impacted If The Crude Oil Prices Average At $50 Per Barrel In 2018?
- How Will United’s Revenue And EBITDA Grow Over The Next Five Years?
- How Important Is United’s International Division For Its Overall Equity Value?
- What Is United’s Fundamental Value Based On 2016 Estimated Numbers?
- Why We Think United Continental Is Worth $65 Per Share?
- What Drove United’s Revenue And EBITDA Growth Over The Last Five Years?
- How Has United’s Revenue And EBITDA Composition Changed Over The Last Five Years?
- What Is United Continental’s Revenue And EBITDA Breakdown?
- How Has United Continental Utilized Its Cash Flows Over The Last Three Years?
- How Have Plummeting Crude Oil Prices Impacted United Continental’s Operating Margin?
Notes:
1) The purpose of these analyses is to help readers focus on a few important things. We hope such lean communication sparks thinking, and encourages readers to comment and ask questions on the comment section, or email content@trefis.com
2) Figures mentioned are approximate values to help our readers remember the key concepts more intuitively. For precise figures, please refer to our complete analysis for United Continental
View Interactive Institutional Research (Powered by Trefis):
Global Large Cap | U.S. Mid & Small Cap | European Large & Mid Cap