The Bangladesh Butter Indicator Says Buy!

Submitted by Sizemore Insights as part of our contributors program
The Bangladesh Butter Indicator Says Buy!
by Charles Lewis Sizemore, CFA
- Will United Airlines Stock Continue To See Higher Levels After A 20% Rise Post Upbeat Q1?
- Up 8% This Year, Why Is Costco Stock Outperforming?
- Down 7% In A Day, Where Is Travelers Stock Headed?
- What’s Next For Johnson & Johnson Stock After Beating Q1 Earnings?
- Should You Pick UnitedHealth Stock At $480 After A Q1 Beat?
- American Express Stock Is Up 17% YTD, What To Expect From Q1?
Get ready to buy. Our most reliable technical indicator—one that has historically been 99% accurate—is suggesting that stocks are poised for a major breakout.
Bangladesh butter production surged in February, as moderating grain prices allowed Bangladeshi dairy farmers to boost production by getting higher milk yields from their existing stock of cows. Meanwhile, butter production in neighboring India dropped significantly in February, as a change in government farm subsidies forced Indian dairy farmers to cull their herds. With Bangladeshi butter production set to rise further, we should be looking at a massive rally in the S&P 500 throughout March and April.
By now, I sincerely hope you realize I’m joking.
Whether the S&P 500 goes up, down or sideways over the next two months will have absolutely nothing to do with the Bangladesh butter indicator. But in a paper published two decades ago, David Leinweber and Dave Krider found that butter production in Bangladesh had the tightest correlation to the S&P 500 of any data series they could find. It wasn’t GDP growth . . . it wasn’t earnings . . . it was Bangladeshi butter, which “explained” 99% of the S&P 500’s movements.
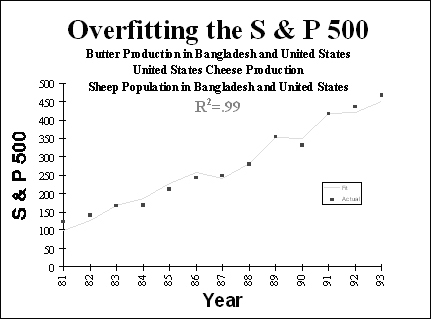
The authors weren’t quacks. They knew the correlation was a random coincidence and completely meaningless. But they published the paper to get a good laugh and to make an important point about number crunching. Correlation does not mean causation, and if your model doesn’t make intuitive sense, it’s probably bogus.
I’m not bashing quantitative models here. Done right, they can help you build a really solid trading system. Various value and momentum models have been proven to work over time. But the trading system needs to reflect some sort of fundamental reality or it’s one (small) step removed from voodoo.
Adam touched on the same idea two weeks ago in Economy & Markets. As Adam wrote, “Computers, databases and statistically sound algorithms can only refine the discovery and implementation of a fundamentally sound investment strategy. At the end of the day, computer algorithms or not, you still need a rock-solid investment strategy.” The model isn’t the strategy. It’s a tool to help you execute; nothing less, nothing more.
Whenever you see someone touting a trading strategy, ask them to explain why it works. Back-tested returns aren’t good enough. If they can’t explain the fundamentals behind their model, it’s probably a matter of time before they blow up.
Oh, and one more thing about Bangladeshi butter. Leinweber wrote in Forbes a few years ago that he still gets phone calls—20 years later—asking for current butter production figures.
This article first appeared on Economy & Markets.
Charles Lewis Sizemore, CFA, is chief investment officer of the investment firm Sizemore Capital Management and the author of the Sizemore Insights blog.
This article first appeared on Sizemore Insights as The Bangladesh Butter Indicator Says Buy!