How Did Each Of 3M’s Segments Perform In Q1 2016?

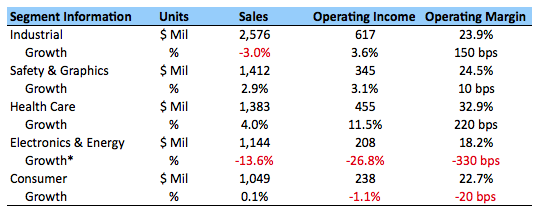
Industrial Business
- Foreign currency negatively impacted sales by 3%, and organic local-currency sales declined 1.9%, led by a 5% fall in the US and 4% in Asia Pacific.
- Sales declined in abrasive systems, industrial adhesives and tapes, and aerospace commercial transportation.
- Weakness in the oil and gas end markets resulted in a fall in advanced materials.
- Sales grew in automotive OEM, automotive aftermarket, and 3M purification, as well as in Latin America and Canada (8%), and in EMEA (1%).
- Improvement in margins was a result of restructuring actions and lower raw material costs.
Safety & Graphics Business
- Sales growth was led by roofing granules, commercial solutions, and personal safety.
- Sales increased 4% in Asia Pacific, 2% in both the US and EEMA, and 1% in Latin America and Canada.
- Operating margins increased due to higher selling prices and lower material costs.
Health Care Business
- Sales growth was seen across the portfolio, led by food safety, and health information systems.
- 11% growth was seen in Asia Pacific, 9% in Latin America and Canada, 6% in EEMA, and 4% in the US.
- Operating margin improvement was due to a combination of higher selling prices, lower raw material costs, and organic volume increases.
Electronics and Energy Business
- Sales declined 18% on an organic local-currency basis, due to a soft end market demand and high channel inventory.
- Sales were flat in EEMA, Latin America and Canada, and the US, and declined 18% in Asia Pacific, where the company’s electronics business is concentrated.
- Lower organic volume and foreign currency effects negatively impacted the margins.
- 3M plans to reduce ~250 positions in this business worldwide, incurring a Q2 expense of $20M.
Consumer Business
- Sales growth was led by construction and home improvement.
- Organic local-currency sales increased 2.8%, while foreign currency translations negatively impacted sales by 2.7%.
- Increase in sales was seen in Asia Pacific (6%), and the US (4%), while sales declined in Latin America and Canada (1%) and EEMA (5%).
- Higher advertising and merchandising investments negatively affected the margins.
Have more questions on 3M? Have a look at the links below:
- What Was The Biggest Factor Which Resulted In A Change In Sales In Q1 2016 In Each Region For 3M?
- 3M Beats EPS, Revenue Estimates
- Will Organic Growth Drive 3M’s Q1 Earnings?
- What Does 3M’s Five-Year Growth Plan Entail?
- What Is 3M’s Plan With Regards To China?
- What Caused The Change In Sales For Each Of 3M’s Segments And How Does It Compare With 2014?
- What Is The Geographic Breakdown of 3M’s Sales?
- How Does 3M Compare With Its Peers In Terms Of R&D Spending?
- What Is 3M’s Fundamental Value Based On Expected 2016 Results?
- How Will 3M’s Revenue And EBITDA Composition Change In The Next 3 Years?
- By What Percentage Did 3M’s Revenue & EBITDA Grow In The Last 5 Years?
- How Has 3M’s Revenue And EBITDA Composition Changed In The Last 5 Years?
- 3M: Year 2015 In Review
- What Is 3M’s Revenue And EBITDA Breakdown?
Relevant Articles
- What’s Next For 3M Stock After A 15% Fall This Year?
- After A 14% Fall This Year Is 3M Stock A Better Pick Over Honeywell?
- What’s Next For 3M Stock After A 24% Fall This Year?
- Should You Pick Starbucks Over 3M Stock For Next Three Years?
- What’s Happening With 3M Stock?
- Will 3M See A Sharp Decline In Q2 Earnings?
Notes:
1) The purpose of these analyses is to help readers focus on a few important things. We hope such lean communication sparks thinking, and encourages readers to comment and ask questions on the comment section, or email content@trefis.com
2) Figures mentioned are approximate values to help our readers remember the key concepts more intuitively. For precise figures, please refer to our complete analysis for 3M.
View Interactive Institutional Research (Powered by Trefis):
Global Large Cap | U.S. Mid & Small Cap | European Large & Mid Cap
More Trefis Research
Global Large Cap | U.S. Mid & Small Cap | European Large & Mid Cap
More Trefis Research