Is the Lululemon Stock Price Driven By Current Earnings or Sentiment?

The Price to Earnings ratio gives us the ability to judge whether a stock is fairly priced or not. In this analysis, we will use the PE ratio to estimate whether Lululemon’s stock price is driven by current earnings or by investor sentiment. That is, we will see to what degree the current PE ratio of the company’s stock is in line with that of the industry.
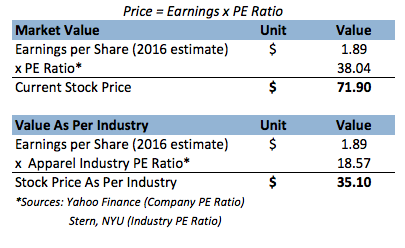
The difference of $36.80 is a premium that one is willing to pay in expectation of future growth. In a previous analysis, we have estimated that almost 38% of the stock price is influenced by future expectations of earnings growth. You can view this analysis here.
Possible Supporting Arguments:
- Lululemon plans to double its sales by 2020 to about $4.6 billion in revenues and $600 million in net profit (using 2015 results as starting points). Furthermore, the company plans to double its women’s business to $3 billion and its men’s business to $1 billion within the same time frame.
- In the recent quarters, management has been very focused on not only a large scale store expansion, but an increase in the average size of its stores. The number of retail stores has gone up from about 211 in 2012 to 363 in 2015 and the company expects to open about 60 more stores in 2016.
- Lululemon has been trying to explore new markets, especially emerging markets in Asia and, Australia and New Zealand. The company has opened new stores here while more are slated to open this year.
- DTC is going to become a big earner for the company with the growing E-commerce boom.
Notes:
- Lululemon’s Stock Down 34% YTD, What’s Happening?
- Down 9% This Year, What’s Next For Lululemon’s Stock Past Q4 Results?
- Lululemon Stock Up 52% In Past Year. What Should You Expect Now?
- Will Lululemon Stock Trade Higher Post Q2?
- Will Lululemon Stock See Higher Levels Post Q1?
- Earnings Beat In The Cards For Lululemon Stock?
View Interactive Institutional Research (Powered by Trefis):
Global Large Cap | U.S. Mid & Small Cap | European Large & Mid Cap
More Trefis Research