Q2 2015 Banking Review: Credit Card Payment Volumes
Card usage volumes in the U.S. jumped sharply in the second quarter of the year after the seasonally weak showing in the first quarter, with steady improvements in the country’s economic conditions driving overall spending. While there has been a notable increase in card balances over recent quarters, the fact that charge-off rates have remained steady indicates that the growth in payment volumes has not come at the price of increased credit risk for card lenders.
The country’s largest card lenders have capitalized on this to boost their top line figures even as the low interest rate environment applies pressure on retail banking revenues. After all, card fees is one of biggest sources of value for banking giants. In this article, which is a part of our ongoing series detailing the country’s largest card lenders – JPMorgan Chase (NYSE:JPM), Bank of America (NYSE:BAC), Citigroup (NYSE:C), U.S. Bancorp (NYSE:USB), American Express (NYSE:AXP), Discover (NYSE:DFS) and Capital One (NYSE:COF) – we detail the growth in their card payments over recent quarters as well as the trends to expect in the near future.
See the full Trefis analysis for Capital One | JPMorgan | U.S. Bancorp | Bank of America | Citigroup | American Express | Discover
Card issuers earn a fee equal to a percentage of the transaction value each time a customer swipes his or her card, and the only avenue for growth in card fees for banks following the regulatory clampdown is an increase in purchase volumes. Each of the lenders has reported notable improvements in card purchase volumes over the last three years. The table below summarizes the U.S. credit card purchase volumes for the lenders in each of the last ten quarters. The data has been compiled using figures reported by individual institutions as a part of their quarterly announcements.
| (in $ billion) | Q1’13 | Q2’13 | Q3’13 | Q4’13 | Q1’14 | Q2’14 | Q3’14 | Q4’14 | Q1’15 | Q2’15 |
| American Express | 116.7 | 125.6 | 124.6 | 134.1 | 124.3 | 136.5 | 136.2 | 145.0 | 132.5 | 144.1 |
| JPMorgan | 94.7 | 105.2 | 107.0 | 112.6 | 104.5 | 118.0 | 119.5 | 123.6 | 112.8 | 125.7 |
| Citigroup | 53.5 | 60.2 | 59.8 | 66.7 | 56.3 | 64.3 | 63.0 | 68.6 | 57.4 | 66.3 |
| Capital One | 41.8 | 47.3 | 47.4 | 50.4 | 44.1 | 52.7 | 53.7 | 58.2 | 52.0 | 62.2 |
| Bank of America | 46.6 | 51.9 | 52.8 | 54.5 | 48.9 | 53.6 | 53.8 | 55.9 | 50.2 | 56.0 |
| Discover | 26.9 | 29.7 | 30.3 | 31.8 | 28.1 | 31.7 | 32.1 | 33.2 | 28.7 | 32.3 |
| U.S. Bancorp | 24.9 | 27.1 | 28.8 | 27.9 | 26.9 | 29.6 | 30.8 | 30.3 | 28.1 | 30.8 |
| Total | 405.1 | 447.0 | 450.7 | 477.9 | 433.1 | 486.3 | 489.1 | 514.8 | 461.8 | 517.4 |
The seven card issuers listed here reported almost $520 billion in total credit card payments in the country for the second quarter of 2015 – making this the best period ever for the industry in this regard. This represents a 12% improvement compared to the figure for the previous quarter, and a 6% jump year-on-year. The dominance of these financial institutions in the card industry is demonstrated by the fact that cards issued by these lenders were used to make purchases of $1.92 trillion in 2014 – 73% of the $2.63 trillion total market size for the year. [1] Notably, each of the banks reported an increase in usage volume compared to Q2 2014 as well as Q1 2015 – with gains for JPMorgan and Capital One standing out in particular.
American Express has the largest market share thanks to its strategy of targeting affluent customers who are likely to use their credit cards for transactions of considerably high values. On the other hand, JPMorgan comes in second because of the sheer size of its credit card customer base, which makes it the largest card lender in the country.
The seasonal nature of card purchase volumes is evident from the table above, which shows that Q1 is the slowest while Q4 is the strongest period for any given year. The primary reason for the fourth quarter’s strength is that the holiday season sees the highest amount of customer spending, followed by a lull in the first quarter. The chart below makes it easier to notice this trend, while also giving a clearer picture of how these card issuers fare with respect to each other.
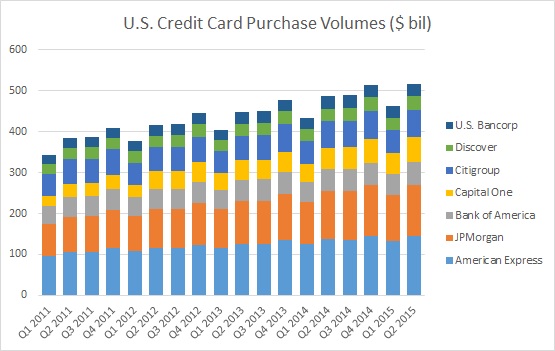
The increase in spending levels over this period is key to higher revenues for the lenders in the coming years. The chart shows how card payment volumes have grown between 6% and 7% year-on-year in each of the quarters since Q1 2011. The exceptionally strong show in Q2 2015 leads us to believe that total purchase volumes for the year 2015 could be between 8-10% higher than the figure for 2014. This points to total purchase volumes of roughly $2.1 trillion for these seven card lenders this year. Going forward, we expect the figure to continue to grow at around 6% annually over the coming years.
View Interactive Institutional Research (Powered by Trefis):
Global Large Cap | U.S. Mid & Small Cap | European Large & Mid Cap
More Trefis Research
- Purchases at Merchants, Nilson Report [↩]