Q3 2015 U.S. Investment Banking Round-Up: Equity Trading

The third quarter of 2015 was a mixed period for the equity trading business. The slump in equity markets around the globe – which was quickly followed by a strong rally – drove demand for trading services. While investment banks benefited from elevated activity levels, the markets did not completely recover their lost value by the end of the period, which led to sizable mark-to-market losses for these banks on their securities portfolios. This resulted in equity trading revenues which were lower than the strong figures witnessed in the last two quarters, although things improved year-on-year. Taken together, the country’s five largest investment banks – Goldman Sachs (NYSE:GS), JPMorgan (NYSE:JPM), Morgan Stanley (NYSE:MS), Bank of America-Merrill Lynch (NYSE:BAC) and Citigroup (NYSE:C) – reported their best third-quarter equity trading revenue figure since the economic downturn of 2008 for Q3 2015.
In this article, which is a part of our ongoing series on the largest U.S. investment banks, we highlight the trends seen in equity trading revenues for the banks over recent quarter, and also how important these revenues are to the business model of each of these banks.
See the full Trefis analysis for Goldman Sachs | JPMorgan | Morgan Stanley | Bank of America| Citigroup
- Trailing S&P500 By 18% Since The Start Of 2023, What To Expect From Goldman Sachs Stock?
- Down 12% In The Last Twelve Months, Where Is Goldman Sachs Stock Headed?
- What To Expect From Goldman Sachs Stock?
- Goldman Sachs Stock Is Undervalued At The Current Levels
- Goldman Sachs To Edge Past the Consensus In Q1
- Goldman Sachs Stock Is Trading Below Its Intrinsic Value
The table below summarizes the revenues each of the five largest U.S. banks generated through their equity trading units for each of the last eleven quarters. These figures have been adjusted for gains/losses linked to a revaluation of the banks’ own debt, as the DVA figures from one quarter to the next are often so drastic that revenues cannot be compared side-by-side without such an adjustment. As the DVA is inherently an accounting-related charge, it doesn’t influence operating revenues for any period.
| (in $ mil) | Q1 2013 | Q2 2013 | Q3 2013 | Q4 2013 | Q1 2014 | Q2 2014 | Q3 2014 | Q4 2014 | Q1 2015 | Q2 2015 | Q3 2015 |
| Morgan Stanley | 1,594 | 1,806 | 1,710 | 1,503 | 1,705 | 1,789 | 1,784 | 1,625 | 2,268 | 2,270 | 1,769 |
| Goldman Sachs | 1,957 | 1,823 | 1,641 | 1,725 | 1,596 | 1,588 | 1,573 | 1,904 | 2,337 | 1,965 | 1,717 |
| JPMorgan | 1,340 | 1,296 | 1,249 | 873 | 1,315 | 1,189 | 1,252 | 1,105 | 1,609 | 1,576 | 1,403 |
| Bank of America | 1,149 | 1,194 | 970 | 904 | 1,153 | 1,032 | 1,026 | 911 | 1,150 | 1,179 | 1,156 |
| Citigroup | 826 | 942 | 710 | 539 | 883 | 659 | 763 | 471 | 873 | 653 | 996 |
The dominance of Goldman Sachs and Morgan Stanley in the equity trading business is evident from the table above. Notably, these banks have monopolized the top two ranks on the list for every quarter since Q1 2011. While Goldman held the top spot in Q4 2014 and Q1 2015, Morgan Stanley was at the top of the list for the next two quarters.
Both Morgan Stanley and Goldman rely heavily on market making, hedging and algorithmic trading operations to boost their top line figures. Morgan Stanley has had the upper hand in recent years, as the sweeping changes it introduced to its business model over 2011-2012 shifted the focus of its business model away from fixed income trading and towards equities. In sharp contrast, Citigroup has a considerably smaller equities trading desk – choosing to focus on fixed income trading instead. Citigroup has not made more than $1 billion in equity trading revenues in any quarter since Q1 2011.
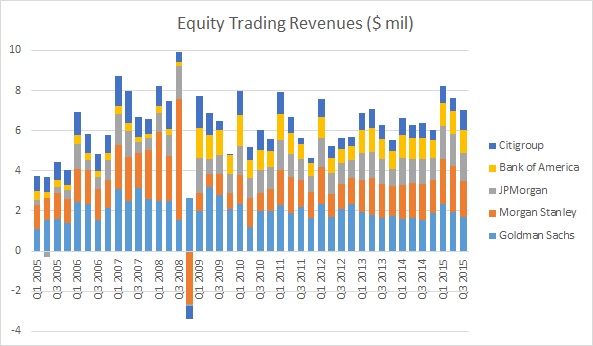
The chart below details the total equity trading revenues for these five banks in each quarter since Q1 2005, and makes it easy to identify trends in these revenues over the last decade. Interestingly, if these banks make more than $7.1 billion in equity trading revenues in Q4 2015 (slightly better than the performance in Q3 2015), then the total figure for full-year 2015 will be the highest in history.
While the figures above allow for a simple comparison of quarterly revenues across the investment banking giants, this data doesn’t really lend itself to an understanding of the relative importance of equity trading desks in a particular bank’s business model. To facilitate a better comparison, we compiled the following table, which consolidates the figures above into a single set of average quarterly numbers. This table includes the average quarterly revenues each bank reported over the period from Q1 2013 to Q3 2015, and has been sorted based on the average equities revenues earned in a quarter.
| (in $ mil) | Total Revenues | Equities Revenues | Equities / Total | Std. Dev. | Std. Dev. / Mean |
| Morgan Stanley | 8,550 | 1,823 | 21.3% | 237 | 13.0% |
| Goldman Sachs | 8,662 | 1,791 | 20.7% | 216 | 12.0% |
| JPMorgan | 23,770 | 1,287 | 5.4% | 196 | 15.2% |
| Bank of America | 21,563 | 1,068 | 5.0% | 105 | 9.8% |
| Citigroup | 19,195 | 749 | 3.9% | 159 | 21.2% |
| TOTAL | 81,740 | 6,717 | 8.2% | 723 | 10.8% |
Goldman and Morgan Stanley stand out in this regard. Morgan Stanley generated over $1.8 billion from its equity trading desk on average, which is a little over 21% of the bank’s average quarterly revenues – the highest among large U.S. banks. Goldman’s equity trading desk put up a near-identical showing over the period, although the revenue share of the equity trading desk is around 21% – the highest among large U.S. investment banks. The chart below captures the size of Goldman’s equity trading assets over the years and also shows our forecast for these assets.
The other three banks generate roughly 4-5% of their total revenues through equity trading – a result of their more diversified business models, which focus considerably on other financial services offerings including retail banking, commercial banking and even custody banking.
Interestingly, both Goldman and Morgan Stanley have among the lowest coefficient of variation (ratio of standard deviation and mean) among these five banks of 12-13%, despite bringing in the most revenue from their equities unit compared to their more diversified competitors. This would suggest that their trading risks are largely balanced – most likely thanks to the sheer volume of trades they execute over any period. Bank of America fares best in this regard, though, as it has maintained equity trading revenues between $900 million and $1.2 billion over the last eleven quarters – with a coefficient of variation of under 10%.
View Interactive Institutional Research (Powered by Trefis):
Global Large Cap | U.S. Mid & Small Cap | European Large & Mid Cap
More Trefis Research