How Can GM Stop Bleeding Money In Europe?

General Motors (NASDAQ: GM) has lost over $3 billion in Europe over the last three years. The company, which was expecting to grow significantly in the region by capturing a large slice of the growth driven by the Russian car market, has seen its market share decline, as it pulled out its Chevrolet brand from many countries in Europe. Most of its recent growth has been driven by the Opel and Vauxhall brands.

The company’s poor performance in Europe is thrown into sharp relief when compared with its performance in the North American car market.
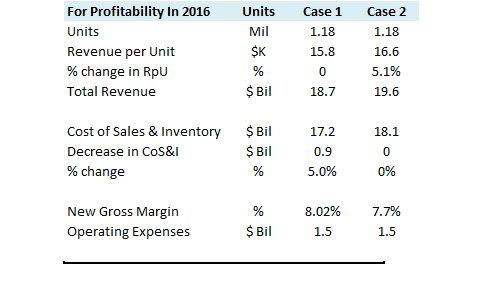
 Below, we describe two cases in which GM can break even at an operating level in 2016. Since most of the workers in GM’s European factories are unionized, it is unlikely that they can cut labor costs. Marketing costs also tend to be rather stable for auto companies, so we assume operating expenditures in both cases to be constant. In the first case, we assume that the company can cut some of its costs in raw materials or inventory. For it to break even, assuming 2015 unit sales and price levels, a 5% reduction in expenses is required. In the second case, assuming no change in cost of sales and flat new units sold, its revenue per unit must increase by 5.1% to $16.6K from $15.8K.
Have more questions about auto companies? Click on the links below:
- How Do Automotive Luxury Brands Compare In Their Performance In China?
- How Does GM’s performance vary across geographies?
- How Do Auto Luxury Brands Compare In The US?
- What Is Driving Changes In Ford’s Annual Unit Sales?
- How Much Money Does Ford Make Per Car Sold?
- How Much Has GM Been Investing In Growth Opportunities?
- How Ford’s Unit Pricing Differs Across Geographies?
- How Much Has Ford Been Investing In Growth Opportunities
- Ford’s Overwhelming Dependence On North America
- How Much Profit Does Ford Make Per Unit Sold In Each Geography?
- How Different China Growth Projections Impact Ford’s Bottomline
- How Ford’s Poor Russia Performance Is Obscuring Gains Made In Rest of Europe
- How Careful Targeting of F-Series Sales Helped Ford Boost Its Profits
- How Honda’s Automotive Business Is Faring In Japan
- The Most Significant Trends For Honda Motor Company
- Honda’s Brand Image Is Changing In The U.S.
- How Honda’s Automotive Performance Differs Across Geographies
- How Much Has Honda Been Investing In Growth Opportunities
- How Differing Japan Growth Projections Impact Honda Motor Company
Notes:
1) The purpose of these analyses is to help readers focus on a few important things. We hope such lean communication sparks thinking, and encourages readers to comment and ask questions on the comment section, or email content@trefis.com
2) Figures mentioned are approximate values to help our readers remember the key concepts more intuitively. For precise figures, please refer to our complete analysis for General Motors
See More at Trefis | View Interactive Institutional Research (Powered by Trefis) Get Trefis Technology