How Have Equity Underwriting Deal Volumes For U.S. Investment Banks Changed In The Last 5 Quarters?

Q1 2016 was a particularly weak period for the global equity underwriting industry – something that weighed on deal volumes for the largest U.S. investment banks for the period. Changes in deal volume for these banks largely mirrored those for the overall industry.

Equity underwriting volumes for individual banks were taken from Thomson Reuters’ investment banking league tables for the last five quarters. The table below captures the respective market shares for each of these banks over this period. The green-to-yellow shading for figures in a quarter should help compare the relative standings of these 5 banking giants in a particular quarter.
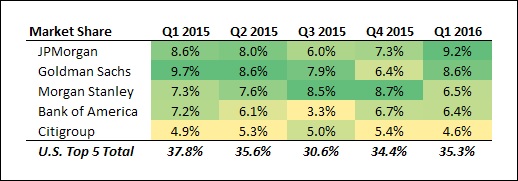
It should be noted that the largest equity capital market deals (IPOs and FPOs) employ more than one investment bank, so the market share figures are not exclusive.
See the links below for more information and analysis about the 5 largest U.S. investment banks:
- How Much In M&A Advisory Fees Did The 5 Largest U.S. Investment Banks Generate In 2015?
- How Much In Equity Underwriting Fees Did The 5 Largest U.S. Investment Banks Generate In 2015?
- How Much In Debt Origination Fees Did The 5 Largest U.S. Investment Banks Generate In 2015?
- What Was The Share Of Major U.S. Investment Banks In Global Equity Underwriting Industry For Q1 2016?
Notes:
1) The purpose of these analyses is to help readers focus on a few important things. We hope such lean communication sparks thinking, and encourages readers to comment/ ask questions on the comment section
2) Figures mentioned are approximate values to help our readers remember the key concepts more intuitively. For precise figures, please refer to the full Trefis analysis for Goldman Sachs | JPMorgan | Morgan Stanley | Bank of America | Citigroup
View Interactive Institutional Research (Powered by Trefis):
Global Large Cap | U.S. Mid & Small Cap | European Large & Mid Cap
More Trefis Research