How Will BP’s Revenue Move If Crude Oil Prices Rebound To $100 Per Barrel By 2018?

The revenues and profitability of an oil and gas company are highly correlated to commodity prices. Thus, the sharp fall in commodity prices over the last two years has resulted in a notable decline in the price realizations for the various commodities. As a result, large oil and gas companies had to pull back their exploration and drilling plans during 2015, leading to a notable decline in their top line as well as profitability. This is the same case with BP Plc. (NYSE:BP), a UK-based integrated oil and gas company. The company witnessed a decline of over 40% in its upstream revenues and almost 50% in its EBITDA in 2015 compared to the previous year.
We currently have a $41 per share price estimate for BP, which is slightly above its current market price.
See Our Complete Analysis For BP Plc. Here
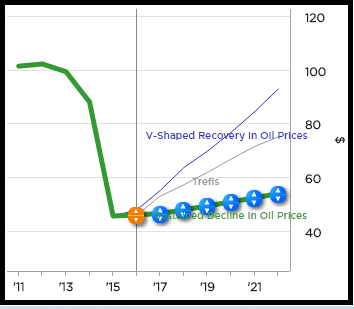
Based on the current market trends, we expect crude oil prices to remain weak in the short term and gradually recover to $70 per barrel by 2018. In this case, BP’s upstream production and price realization are likely to remain low in 2016 and grow gradually over the following two years. These numbers are presented in the table below under the base case calculations. If, however, the commodity markets recover faster-than-expected and crude oil prices rebound to $100 per barrel by 2018, the company’s revenue in 2018 will be roughly 20% higher than our base case.
Crude Oil Price Scenario – By Trefis
See Our Complete Analysis For BP’s Upside Case Here

Have more questions about BP Plc. (NYSE:BP)? See the links below:
- How Will BP’s Revenue Move If Crude Oil Prices Average At Around $50 Per Barrel Till 2018?
- How Does BP Plan To Manage Its Operating Margins In The Current Commodity Downturn?
- How Will BP’s Production Grow Over The Next Five Years?
- BP Q1 Earnings: Revenues And Profits Suffer Due To Low Oil Price Environment, Cash Outflows Still Greater Than Inflows
- What’s BP’s Revenue & Earnings Breakdown In Terms of Different Products?
- What’s BP’s Fundamental Value Based On Expected 2016 Results?
- How Has BP’s Revenue Composition Changed In The Last Five Years?
- What Has Led To More Than 25% Decline In BP’s Revenues & EBITDA In The Last Five Years?
- By What Percentage Can BP’s Revenues Grow Over the Next Five Years?
- How Are BP’s Revenue & EBITDA Composition Expected To Change By 2020?
Notes:
1) The purpose of these analyses is to help readers focus on a few important things. We hope such lean communication sparks thinking, and encourages readers to comment and ask questions on the comment section, or email content@trefis.com
2) Figures mentioned are approximate values to help our readers remember the key concepts more intuitively. For precise figures, please refer to our complete analysis for BP
View Interactive Institutional Research (Powered by Trefis):
Global Large Cap | U.S. Mid & Small Cap | European Large & Mid Cap