My 2012 Midyear Outlook for Oil Demand

Submitted by Investing Daily as part of our contributors program.
West Texas Intermediate (WTI) crude oil prices tumbled 30 percent from their high of $110 per barrel in late February to less than $80 per barrel toward the end of June. Meanwhile, Brent crude oil declined from a 2012 high of more than $128 per barrel to a recent low of less than $90 per barrel.
The drop in oil prices far exceeds the decline in equities: At its June low, the S&P 500 had given up almost 12 percent from its 2012 high.
In recent weeks, I’ve received a number of emails asking about my outlook for oil prices and what the decline in energy prices means for oil investing.
First, let’s look at what’s driving the recent weakness in oil prices. Investors have grown increasingly concerned that the slowing global economy will erode demand for crude oil.
Although EU oil consumption will weaken and China’s economic growth has slowed relative to prior years, the recent drop in oil prices already more than reflects these headwinds. Moreover, current prices don’t reflect the potential for emerging-market oil consumption to pick up in the second half of the year. Investors also shouldn’t discount the stimulative effect that lower oil prices will have on the US economy and demand.
a
Source: Energy Information Administration
In the first 25 weeks of 2012, US crude and refined products demand has declined by 3.18 percent from year-ago levels. Some of this weakness reflects reduced demand for heating oil during the unseasonably warm 2011-2012 winter. However, other factors are at work: Through the end of April, US gasoline consumption had slipped 1.4 percent year over year, while jet fuel demand was down 0.8 percent.
The four-week moving average of US oil and refined-products demand shows a clear break in the steady uptrend in US oil consumption after the Great Recession. As the economy recovered and the credit crisis eased, US oil demand bounced off its 2009 and early 2010 lows but never regained its pre-2007 levels. In fact, the nation consumed less oil in 2011 than a decade earlier.
Although the US remains the world’s largest oil consumer in absolute terms, the decline in domestic consumption is neither an unforeseen development nor a major driver of oil prices. The International Energy Agency’s February Oil Market Report forecast that North American oil demand would decline by 109,000 barrels per day in 2012; the agency subsequently revised this estimate to 194,000 barrels of oil per day–still an insignificant volume in a global market that amounts to 90 million barrels of oil per day.
This year, rising oil prices have contributed to demand destruction in the US. US retail gasoline prices peaked in early April at almost $4 per gallon and have declined steadily since; in fact, retail gasoline prices have dropped for 11 consecutive weeks–their longest continued downtrend since the dark days of 2008.
But demand has rebounded as oil prices have declined. In April, US gasoline consumption was down only 1 percent from year-ago levels, while weekly data from May indicates that gasoline demand was up 0.15 percent compared to the same month in 2011. Falling retail gasoline prices at the beginning of the summer driving season should support an uptick in US oil consumption.
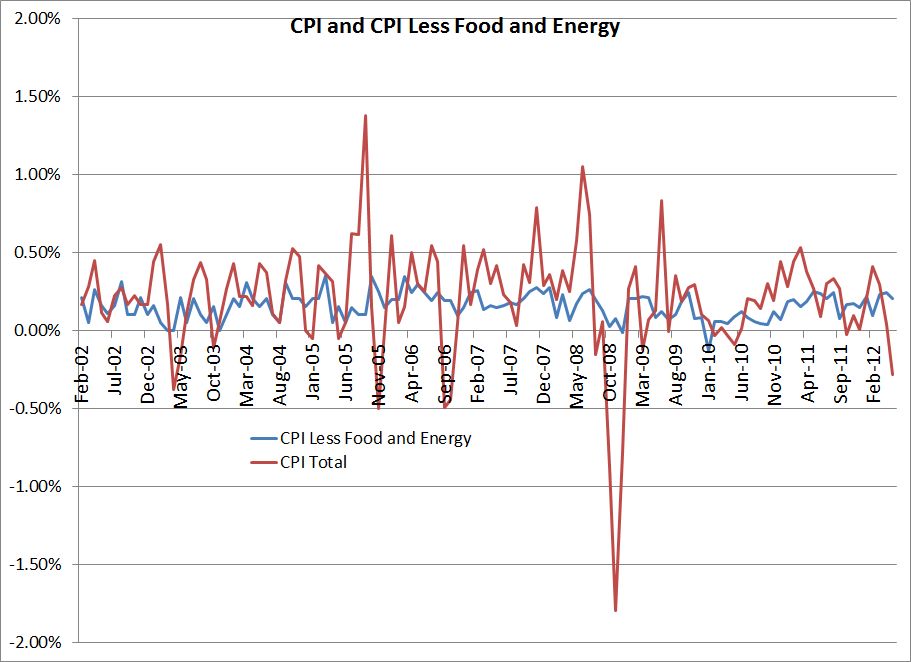
Similarly, elevated oil prices have been a major headwind for the US economy. Check out this graph comparing monthly changes in the US Consumer Price Index (CPI) to noncore CPI, a measure of inflation that excludes food and energy prices. As you can see, CPI ran well ahead of the core number early in both 2011 and 2012
Source: Bloomberg
Last year, the spike in CPI reflected an upsurge in food and energy commodities, driven in part by rising crude oil prices after the outbreak of civil war in Libya and speculation that the Arab Spring uprisings would spread to Saudi Arabia.
This year, energy prices spiked because of escalating tensions between the West and Iran, as well as significant project delays in non-OPEC countries outside North America. When CPI rises at a faster pace than core CPI, US consumers must spend more on energy and less on other items.
US retail sales data weakened in the wake of the 2011 oil price spike and appear to be weakening in response to the 2012 run-up in oil prices. But with core CPI beginning to fall in May 2012, this headwind is becoming a tailwind. In summer 2011, lower oil prices helped to support retail sales; I expect this year’s prolonged decline in energy prices to have at least an equivalent impact.
As you might expect, historical data tracking the miles driven by vehicles in the US exhibit similar trends to US oil and refined-product consumption over the long run.
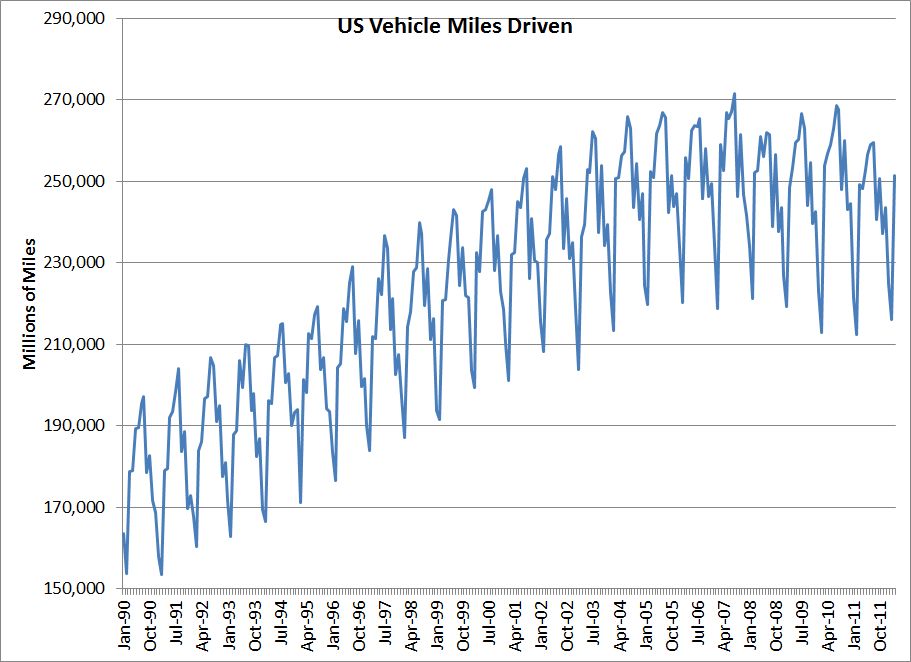
Source: US Dept of Transportation
The 2007-09 financial crisis and the lackluster economic recovery have ended a long-running uptrend in miles driven.
But the pace of the decline in miles driven has slowed. In the first three months of 2012, Americans drove about 1.4 percent more miles than they did in the first quarter of 2011, despite higher year-over-year gasoline prices. The unusually warm 2011-12 winter and the lack of significant snowfall likely contributed to this trend. However, vehicle miles driven in the Gulf Coast and the Southeast–states less impacted by winter weather–were up 1.0 and 0.8 percent, respectively, in March, the latest month for which the government has supplied data.
Americans also may have reached their limit in terms of cutting back on their car travel. Although sky-high gasoline prices and weak economic growth may have reduced the appeal of long road trips, it’s much harder for consumers to cut back on commutes to work or short trips near their home.
The only other way to cut back on fuel consumption is to buy a more fuel efficient car. But fuel economy takes a long time to have a meaningful impact. The average age of US passenger cars reached a record high of 11 years in recent months and has risen steadily from about 8.5 years in the mid-1990s.
Almost 250 million cars are on the road in the US; even if new car sales return to pre-crisis levels, it would take time to renew and upgrade the US automobile fleet.
Given the stabilization of vehicle miles driven, the lack of a near-term bump in fuel efficiency and falling energy prices, I expect US oil demand to decline only slightly in the near term.
Meanwhile, the EU faces severe economic headwinds related to the Continent’s ongoing sovereign-debt crisis and painful budgetary cuts. Economic conditions in Europe have deteriorated to the point that a mild-to-moderate recession is a virtual certainty.
Check out this graph tracking the purchasing managers index (PMI) for the EU manufacturing sector. Readings greater than 50 indicate an expansion in economic activity; PMI values of less than 50 indicate a contraction, with data points below 45 or 47 indicating that a recession is imminent or in force.
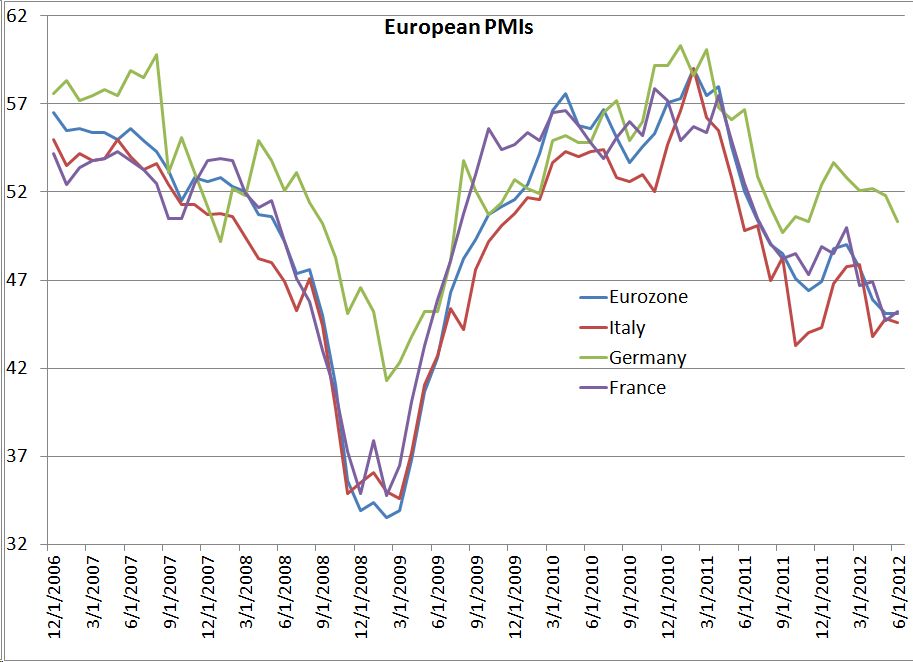
Source: Bloomberg
The June PMI reading of 45.1 is tied for the worst reading in three years. Italy’s PMI clocked in at 44.6 in last month, while France posted a reading of 45.2 and Germany’s PMI barely managed to hold above 50.
Peripheral EU economies such as Greece, Italy and Spain remain the epicenters of the sovereign-debt crisis.
A year ago, yields on bonds issued by Italy and Spain’s governments surged to unsustainable levels. The European Central Bank (ECB) provided some momentary relief by agreeing to purchase bonds on the secondary market in August 2011. Four months later, the ECB implemented long-term refinancing operations (LTRO) that enabled European banks to borrow money from the ECB over three-year periods at preferential rates. This eliminated some of the immediate liquidity concerns surrounding EU banks.
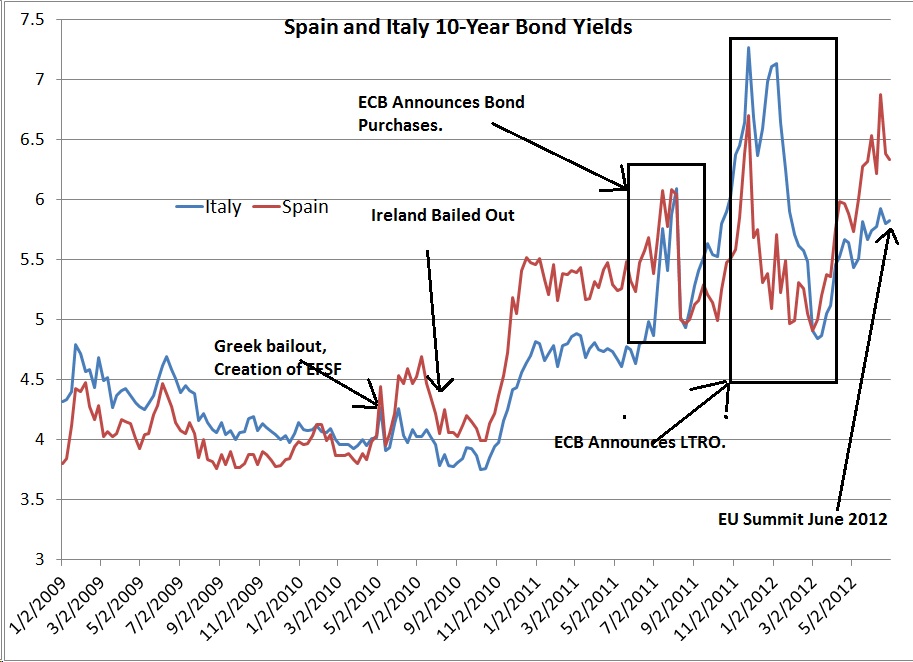
Source: Bloomberg
But by March 2012, yields on Italian and Spanish government debt climbed once again. On June 28, the EU announced additional measures to address the credit crisis.
A new banking regulator will be established under the auspices of the ECB. Once this new regulator is in place, the European Stability Mechanism (ESM)–the region’s EUR800 billion ($1 trillion) permanent bailout fund–will be able to recapitalize banks directly. Prior to this agreement, the ESM and its predecessor, the European Financial Stability Fund (EFSF), could only lend to national governments that, in turn, would lend to financial institutions.
This move will keep the EUR100 billion that Spain received to bail out its banks off the government’s balance sheet. The cost of recapitalizing Spain’s banks would have further bloated the nation’s ratio of government debt to gross domestic product (GDP), limiting the country’s ability to borrow money.
Spanish government bonds purchased as part of the bailout and loans made to support Spain won’t take seniority in the event of a default, a move that should attract private investors to the market. By encouraging private investors to purchase bonds issued by the Spain’s government, policymakers hope to avoid future bailouts.
The ESM and EFSF can purchase government-issued bonds in on the secondary market, helping to lower the borrowing costs of fiscally weak EU nations. Prior to this agreement, the bailout funds were set up to lend money directly to governments in exchange for strict austerity measures.
Stock markets rallied in the wake of these announcements and yields on Italy and Spain’s sovereign debt declined sharply, as this plan would dramatically reduce the odds that Europe’s troubles will escalate into a global credit crunch.
But as I wrote in The Summit Surprise: No Sustainable Upside, investors should also remember that this plan isn’t the first response to the EU sovereign-debt crisis. Previous solutions have proved only temporary. The latest agreement also leaves plenty of questions unanswered.
For one, the EUR800 billion at the ESM’s disposal includes the EUR300 billion that the EFSF already lent to countries requesting bailouts. This EUR500 billion in new capital may prove insufficient to support Spain’s USD1.4 trillion economy and Italy’s USD2.1 trillion economy.
Moreover, Finland and the Netherlands plan to block measures that would allow the ESM to purchase sovereign bonds on the secondary market. At the very least, this discord indicates that EU leaders remain deeply divided as to how to address the crisis.
The deal also stopped short of further fiscal integration, including the creation of a common EU sovereign bond or a central system for guaranteeing bank deposits.
Moreover, Europe’s economy remains mired in at least a mild recession, while Italy and Spain’s economic growth will remain constrained by tax hikes and cuts in government spending.
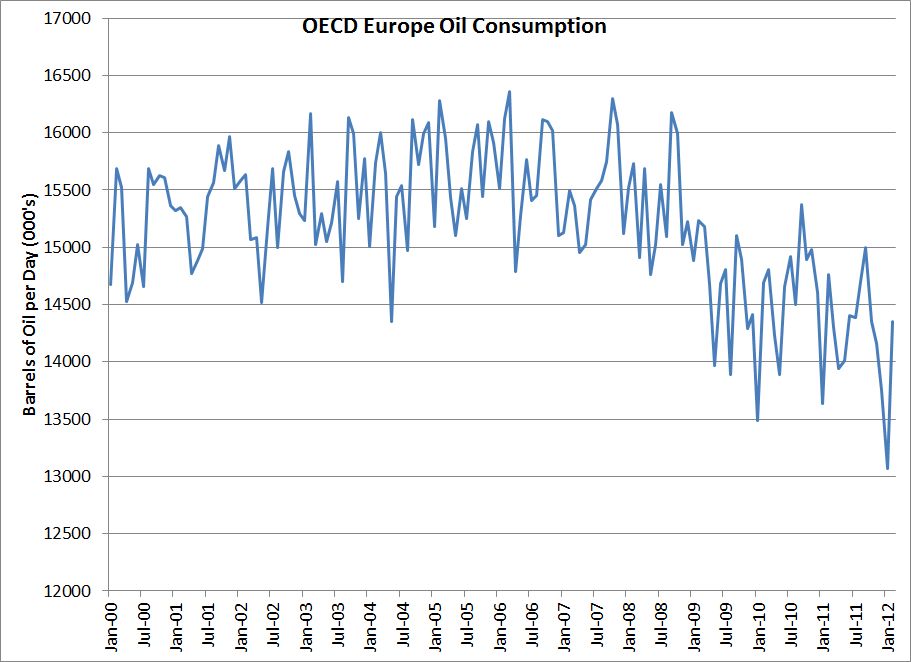
Source: Energy Information Administration
As in the US, European oil demand has languished since the 2007-09 financial crisis. According to preliminary IEA data, oil consumption in Europe’s developed economies tumbled by about 400,000 barrels per day in the first four months of 2012, paced by a 14.9 percent drop in Italy, a 7.8 percent decline in Spain and a 16.5 plunge in Greece.
I expect EU oil demand to fall through the rest of 2012, though the year-over-year rate of decline should slow in the second half because of easier comparisons. Investors shouldn’t be surprised if European oil consumption tumbles by 300,000 barrels to 400,000 barrels per day.
These modest declines in US and European oil demand–a scenario that’s more than reflected in prevailing oil prices–should be more than offset by rising consumption in Brazil, China, India and otheremerging markets. The IEA estimates that non-OECD oil demand in April 2012 climbed by about 900,000 barrels per day from year-ago levels.
Speculation that China’s economic growth will slow relative to prior years has driven the recent weakness in oil prices. China’s GDP growth has slowed to an annualized rate of 8 percent from 11 percent in early 2011, while China’s PMI slipped to 50.2 in June, down slightly from 50.4 in May.
HSBC Holdings (LSE: HSBA, NYSE: HBC) published an alternative PMI for China that includes more data from smaller firms. This index came in at 48.2 in June, suggesting that smaller firms in China are struggling relative their larger counterparts.
But as my colleague, Roger Conrad, writes in Dividend Investors: Don’t Worry About Europe, Keep an Eye on China, investors forget that China’s economic slowdown largely stems from Beijing’s efforts to rein in inflation. The government steadily increased banks’ reserve requirement in 2010 and early 2011. As these efforts brought inflation in check, Chinese authorities have reversed course, slashing reserve requirement ratios three times since late 2011 and reducing interest rates in June. These stimulative moves have revived residential real estate lending, with mortgage volumes in May surging 8.5 percent year over year.
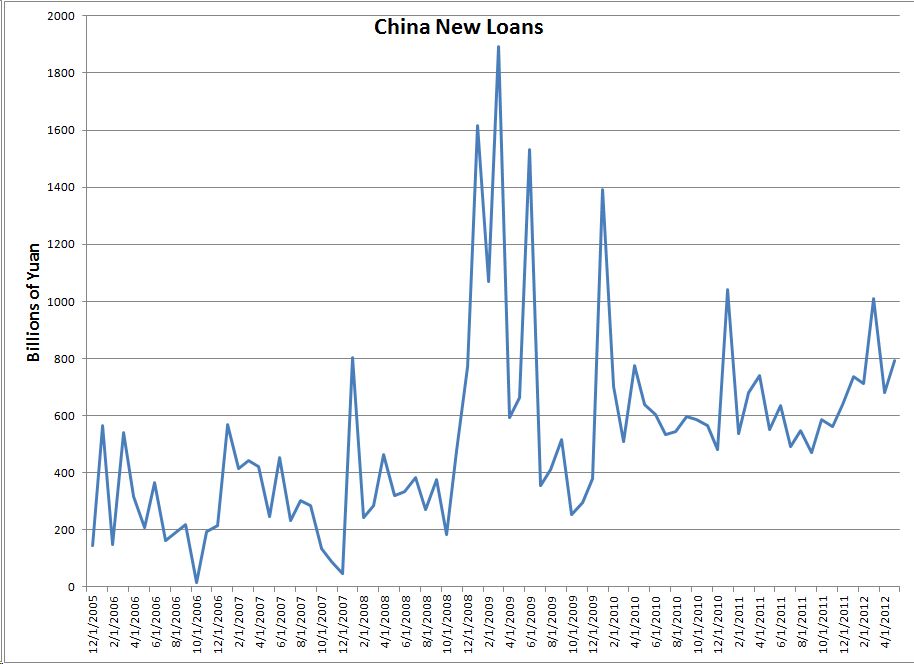
Source: Bloomberg
As you can see, loan volumes have picked up somewhat in China since late last year, and analysts expect the data for June to exhibit another surge from year-ago levels. Policymakers have signaled their willingness to implement additional growth initiatives, likely in the form of interest rate cuts and further reductions to banks’ reserve requirements.
A stimulus similar to China’s 2008-09 spending spree probably won’t be in the cards, but Beijing could approve a smaller package if the global economy were to falter.
At any rate, China’s oil demand hasn’t slowed. Oil imports hit a record high in May.
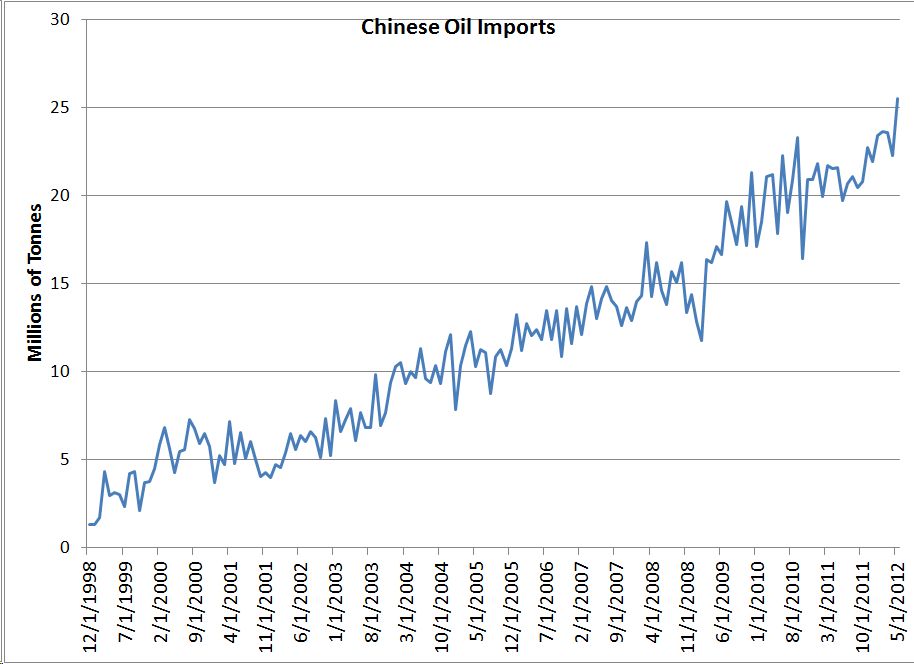
Source: Bloomberg
Uncover five energy stock picks that are resistant to swings in the price of oil by checking out my free Top MLP Investments report.