Why You Shouldn’t Lose Sleep Over The Tech Boom

Positive investor sentiment towards the technology sector has resulted in a significant increase in tech company valuations in the public markets over the last few months, and has also helped boost valuations for private tech companies to unprecedented levels. Institutional and retail investors have been looking beyond the public markets for attractive returns, and have been increasingly participating in late-stage venture financings. This influx of capital has contributed to the rising valuations and raised concerns about another tech bubble, as venture capital funds are also investing more cash in tech startups worldwide than at any time in the past.
While this may very well be another tech bubble – or at the very least a tech “boom” – many of the concerns, and comparisons to the 2000-era bubble, are overblown. The biggest differentiating factor between then and now is that tech companies are not rushing to go public. In fact, this helps to explain the elevated levels of private funding for tech companies prevalent today. And while every tech company that went public in the first half of 2015 saw a jump in valuation within days, tech IPOs have actually been relatively sparse. Accordingly, much more of the risk of capital erosion in the current tech boom is shouldered by private investors rather than the public markets, which crashed after the dot com bubble burst.
- Down 40% In The Last 12 Months, Is Alibaba Stock Undervalued At $70 Per Share?
- Down 65% Since 2021, What’s Next for Alibaba Stock?
- With Regulatory Issues In The Rearview Mirror, Alibaba Appears Cheap At $90
- Alibaba Stock Looks Undervalued At $80 Per Share
- Alibaba Stock’s Low Relative Valuation, Strong Earnings Make It A Buy
- Do Recent Regulatory Developments Make Alibaba Stock A Buy?
Tech Sector Has Significantly Outperformed The Market
The magnitude of the rally in the tech sector is demonstrated by the performance of indices tracking technology stocks relative to those that cover the broader market. The chart below shows the performance of the NASDAQ 100 Technology Sector (NDXT) index and the S&P 500 index from early 2006 through the first half of 2015.

(Source: Google Finance)
As evidenced by the chart above, the share prices of tech companies moved largely in tandem with the broader equity market from 2006 through 2008. However, many tech firms were less affected by the subsequent economic downturn than those in other sectors, and valuations began to diverge in early 2009. This divergence peaked in early 2011, and tech index movements thereafter were mostly in lockstep with the overall market through 2012. Valuations began to diverge further in 2013, which was partially driven by the aftereffects of Facebook’s (NYSE:FB) 2012 IPO. The trend was augmented in late 2014, when e-commerce giant Alibaba (NYSE:BABA) raised $25 billion in what was the world’s largest IPO. Overall, while the S&P 500 has increased in value by roughly 140% since the beginning of 2009, the NDXT has gained 300%. This trend, however, is not unique to the public markets.
Tech Startups Receiving Unprecedented Levels Of Funding
With an influx of cash into VC funds, the aforementioned participation of non-traditional investors in venture financings and the growth of tech communities in international markets, it’s no surprise that total VC investments have grown steadily over the past few years. The chart below shows total VC financing by quarter as well as the average size of funding rounds, and has been compiled using quarterly VC deal data provided by Preqin. ((Q2 2015 Venture Capital Deals, Preqin Press Releases, Jul 1 2015))

Not only has there been a sharp increase in total funding volume, but the average size of funding rounds has ballooned as well. The average quarterly volume of total VC deals between Q2 2014 and Q1 2015 was almost $27 billion, compared to a figure of under $14 billion from Q1 2012 through Q4 2013. Meanwhile, the average deal size has tripled from around $6 million in 2012-2013 to $18 million in Q2 2015. Extending the timeframe shows some parallels between the current financing environment and that of the dot com boom. The chart below shows the average size of VC funding rounds for each year since 1990. It is based on figures compiled by Kleiner Perkins Caufield & Byers (KPCB) as a part of its Internet Trends 2015 report, [1] while data for the most recent quarter has been obtained from Preqin’s quarterly VC deals report. [2]
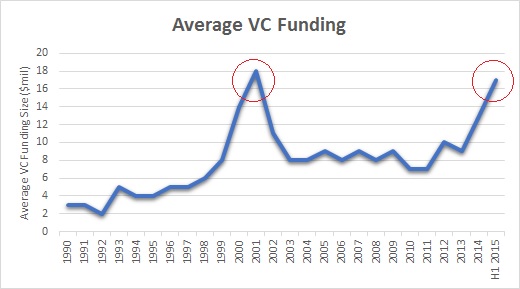
While figures for 2015 only represent activity over the first half of the year, there certainly appear to be some similarities between the environment in 1999-2000 and now. The average size of funding rounds in 2014 was second only to the peak figure seen in 2000, while the average size for this year is nearly identical to the highs seen in 2000-2001. While those 2014 and 2015 jumps were driven to an extent by a few massive later-stage funding rounds (such as Uber’s Series E, which was expanded to $2.8 billion in Q1), the enthusiastic investor sentiment and more readily available capital have also contributed significantly.
The table below provides a clearer picture of the valuation boom, using data compiled by the Wall Street Journal and Dow Jones VentureSource to capture the total number of private companies valued at $1 billion or more since January 2014. [3]
| U.S. | Asia | Europe | Other | Total | |
| Jan 2014 | 29 | 9 | 2 | 2 | 42 |
| Apr 2014 | 40 | 9 | 2 | 2 | 53 |
| Jul 2014 | 43 | 11 | 2 | 2 | 58 |
| Oct 2014 | 51 | 14 | 2 | 2 | 69 |
| Jan 2015 | 50 | 19 | 6 | 2 | 77 |
| Apr 2015 | 60 | 23 | 8 | 2 | 93 |
| Jul 2015 | 72 | 25 | 9 | 1 | 107 |
The number of private firms with billion-dollar valuations swelled from 42 at the beginning of 2014 to 107 in July. To put this in perspective, only 16 firms were valued at a billion dollars or more by VCs at the time of the the dot com boom in 1999-2000. [4] Even if we adjust current valuations for the cumulative inflation figure of roughly 40% over the last fifteen years, 62 of these 107 firms would still have a valuation exceeding $1 billion, which is nearly 4x what was seen in 1999-2000.
Enthusiasm Also Demonstrated In IPOs
Another indicator of the high level of demand among investors towards technology firms is the substantial rallies in the stocks of nearly all the tech firms that went public over the first half of the year. The table below lists all the U.S. tech IPOs from the first half of 2015, and includes the peak levels their share prices reached, as well as the closing prices at quarter-end on June 30.
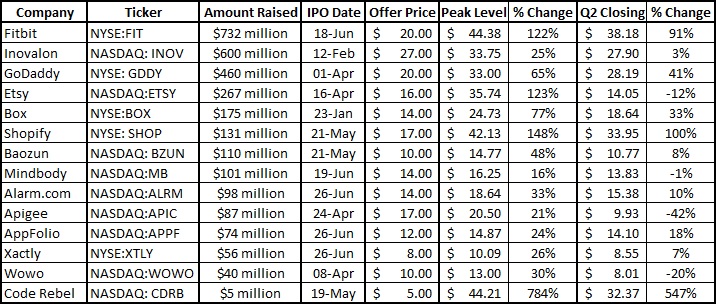
Notably, the share price for every one of these companies increased substantially after listing, with gains ranging from 16% over the listing price in the case of Mindbody to a whopping 784% jump for Code Rebel. While the mean is skewed somewhat by Code Rebel’s massive rally, using the median value, these companies saw their share prices increase by an average of 40% at their peaks. While four of the companies saw their share prices close below their listing prices at the end of the quarter, it should be noted that the global equity market took a tumble in the last few weeks of June due to Greece’s debt turmoil. Despite the sell-off across sectors, five of the 14 companies were still trading at premiums of at least 30% to their listing prices on June 30.
What’s Different This Time Around?
This current tech boom is different from, and less problematic than, the previous one for a variety of reasons. However, most prominent is that there is much less activity in the IPO market. The table below also uses data from Kleiner Perkins’ Internet Trends report, and shows the total tech IPO volume for each year since 1990. [3]
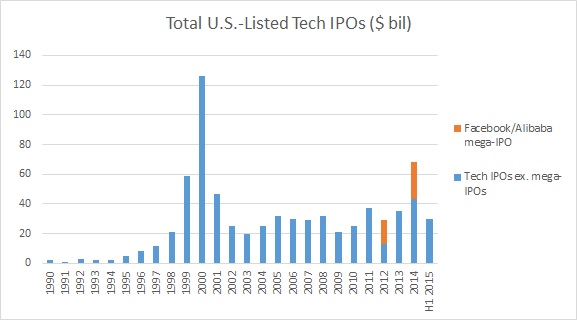
The data for 2012 and 2014 has been modified to show the impact of two massive IPOs on the total volume for those years. The figure for 2012 was doubled because of Facebook’s $16 billion IPO, whereas Alibaba’s $25 billion IPO represented more than 30% of the total tech IPO volume for 2014. Excluding Facebook and Alibaba from the totals, the growth in technology IPOs over the last four years has hardly been alarming, and is certainly not comparable to the six-fold growth in IPO volumes between 1998 and 2000.
Furthermore, any IPO volume growth in the near term may be modest, if recent IPO valuations are any indication. Data compiled by Deutsche Bank shows that the median revenue multiple for tech IPOs conducted in the first half of 2015 was 3.6x. [5] This is well below the figure of 6x for 2014, and a far cry from 1999, when the median revenue multiple for tech IPOs was 26.5x. ((Building A Moat In A Bubble: Navigating Today’s Financing Environment, TechCrunch, May 2015)) This may indicate that investors have become wary of potential overvaluation in tech companies – which would likely extend the trend of tech startups remaining private for longer.
Uber’s latest funding round reportedly valued the company at over $50 billion, which is more than 25x its expected 2015 revenue. [6] [7] Meanwhile, many other highly valued companies, such as Snapchat, are valued at significantly higher multiples than that. While this wouldn’t necessarily preclude them from going public, the IPO market certainly appears to be more discerning than in 1999-2000. But with VCs and other investors competing heavily to invest in these later-stage deals, most of these tech companies don’t seem to be in a rush to go public, as they already have access to all the capital they need.
Given that most of these massive valuations are for private companies, many of which appear perfectly content to remain private in the near term, the public markets are much more insulated from the risk of any capital erosion than they were during the dot com boom. So while we do appear to be in the midst of a tech boom, maybe even a minor bubble, the ramifications of a potential collapse would be much less far-reaching.
View Interactive Institutional Research (Powered by Trefis):
Global Large Cap | U.S. Mid & Small Cap | European Large & Mid Cap
More Trefis Research
- Internet Trends 2015, KPCB, Slideshare [↩]
- Q2 2015 Venture Capital Deals, Preqin Press Releases, Jul 1 2015 [↩]
- The Billion Dollar Startup Club [↩] [↩]
- For Billion-Dollar Companies, Venture Deals Outstrip Going Public, The Wall Street Journal, Aug 19 2015 [↩]
- MoneyBeat: Who Needs Tech IPOs?, The Wall Street Journal MoneyBeat, Aug 2 2015 [↩]
- Uber Eyes $50 Billion Valuation in New Funding, WSJ, May 2015 [↩]
- Uber Valued At More Than $50 Billion, WSJ, July 2015 [↩]